
Design Insights: How Users Interact with Split-Screen in Industrial Visualization
Exploring how user research revealed new ways to make side-by-side views more intuitive and context-aware in large-scale data environments.
Type: Enterprise UX — Visualization Platform for Industrial Operations
Team: Core UX & Engineering Collaboration
My Role: UX Designer — Discovery, Research, Interaction Design, Prototyping
Timeline: 2022
Goal: Improve the usability of the split-screen feature by aligning interaction patterns with how engineers naturally navigate complex operational data.
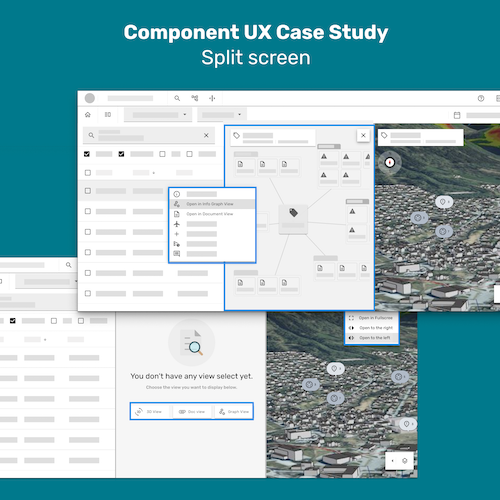
Confidentiality Statement
This article has been prepared for portfolio presentation. All product names, data, and visual references have been generalised or re-created in compliance with company confidentiality obligations.

Background
In complex visualization systems, users often need to view multiple perspectives at once — for example, comparing data from different sources or reviewing real-time and historical states side-by-side.
The existing split-screen workflow supported technical precision but lacked predictability and discoverability. Users often felt uncertain about which pane they were editing, or how to reset layouts once multiple views were open.
Our objective was to design an interaction model that made split-screen navigation intuitive, consistent, and scalable across diverse workflows.
Problem / Use Cases
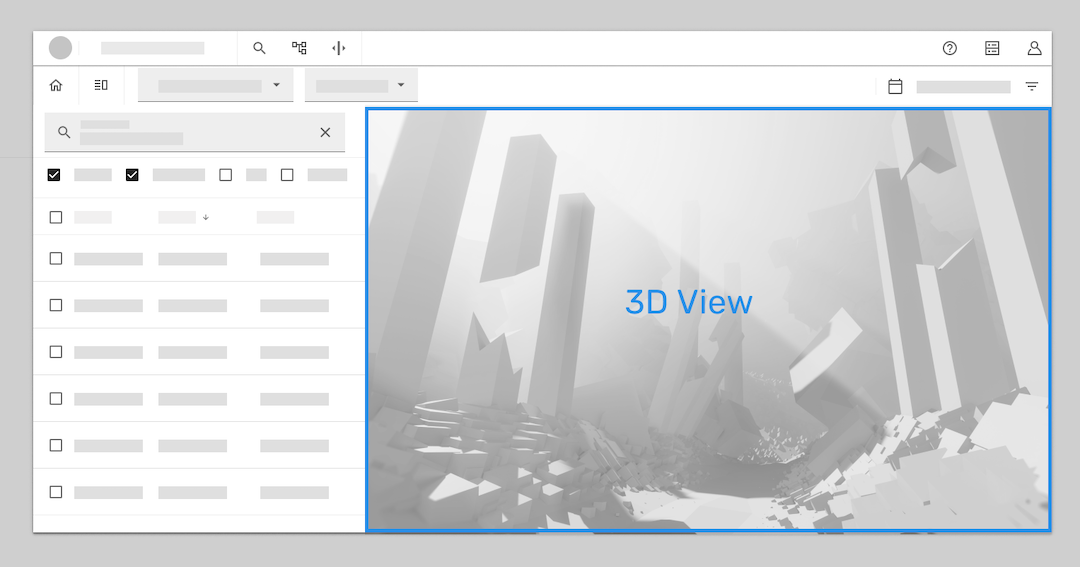
In a high-complexity monitoring workflow within an industrial visualization system, users begin in a 3D spatial overview where they can locate tasks or assets from a data table.
1. From there, they can access related information — such as reports, diagrams, or contextual data — through quick-access menus.
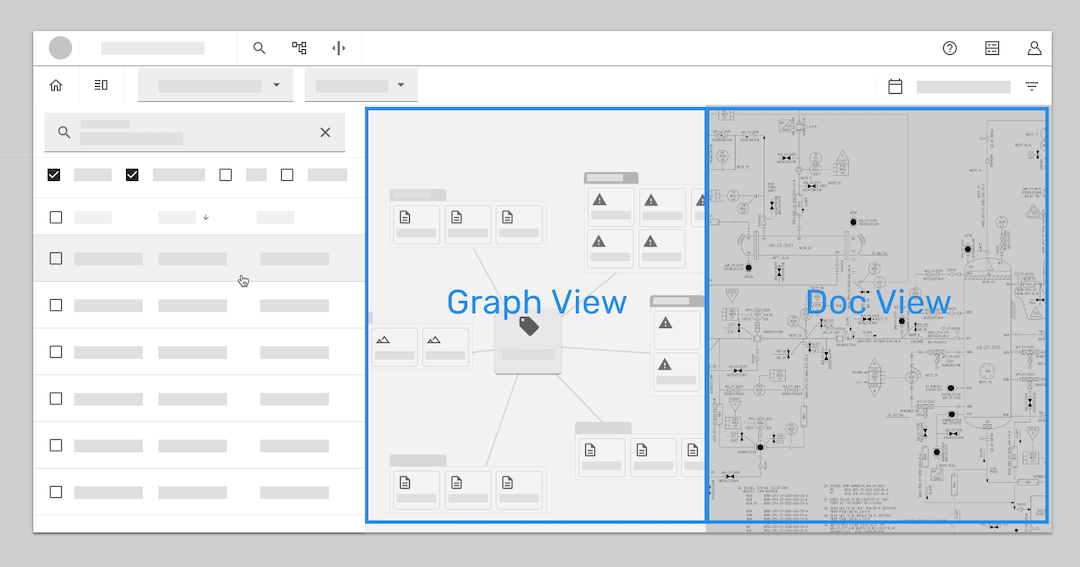
However, when multiple secondary views open at once, the system automatically splits the workspace into two panels. This works fine in most cases, but the behavior becomes inconsistent when users open only one type of view — the interface still triggers a split, even when it’s not needed.
2. To return to the main 3D context, users must close all panels manually, which interrupts their flow and creates uncertainty about navigation.
As a result, users felt disoriented because the split-screen behavior lacked predictability. The flow for opening and closing panels was unclear, making it difficult to understand how to return to the original workspace.
UX Problem: The split-screen interaction lacked consistency and clarity. Users couldn’t anticipate how new panels would open or how to navigate back to their starting point — leading to frustration and reduced confidence in the interface.
User & Persona
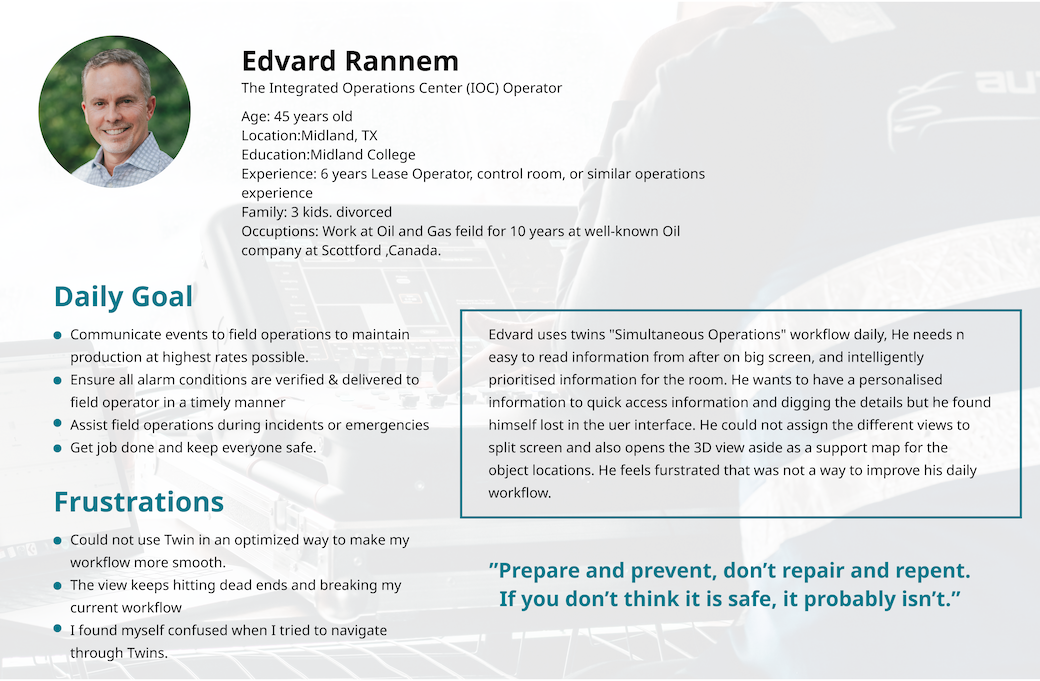
Persona: “IOC operator” — someone working in control rooms, monitoring operations, needing visibility over tasks, alerts, documents, relationships between objects, etc.
User flow & needs:
- First glance / overview: See a clear, unobstructed view of the control room or operations.
- Arriving at terminal: Identify tasks, get personalized info, drill into details.
- Routine work: Observe multiple data views, prioritize tasks, dig into relationships and documents.
- Meetings / planning: Bring together relevant documents, notifications, history, annotations, layering information.
Key pain points discovered via UX research / feedback sessions:
- Landing in 3D view by default is not useful when the user doesn’t know what to search yet.
- Split view opens in unpredictable ways.
- The flow has dead-ends; users often lose track or can’t find their way back.
- Users want control: “show me what I ask for, allow me to hide it, and bring it back easily.”
User interview
I conducted interviews with IOC opreator user to understand how they manage multiple views in their daily work. Their feedback highlighted the need to maintain visual context and control over visible screens, which directly informed the split-screen design.
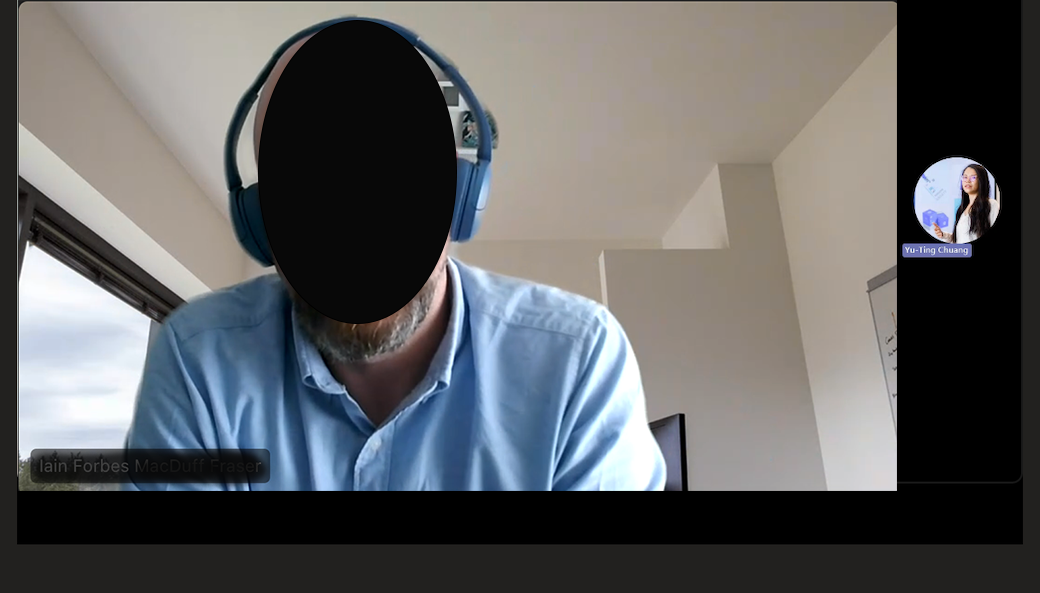
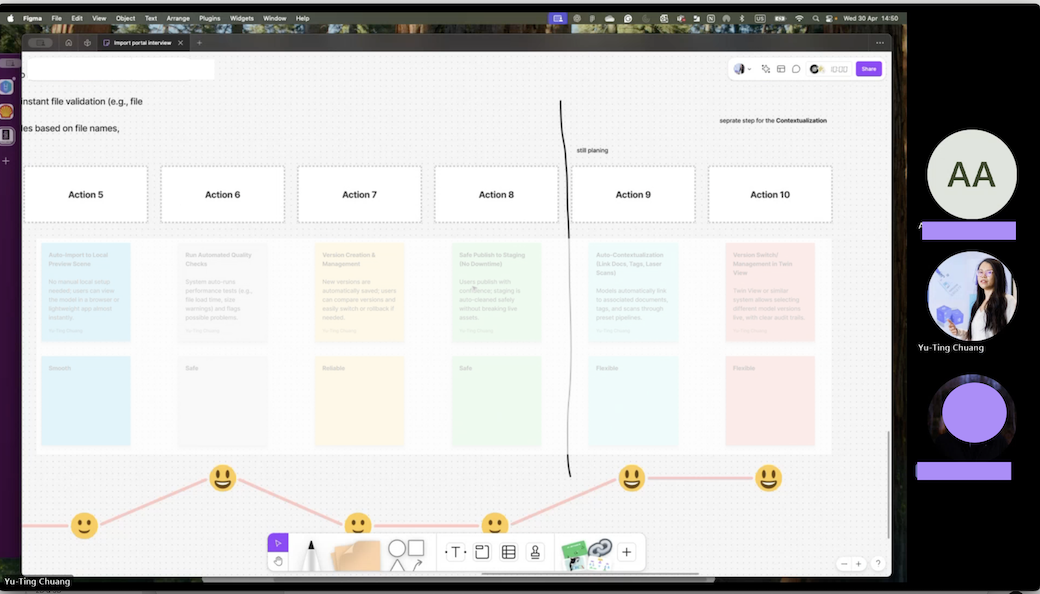
We also held several user journey discussions to better understand how people moved through the system in real scenarios. These conversations helped us identify key moments of friction, clarify user goals, and uncover the context behind their actions. By mapping these journeys, we could align the split-screen behavior with how users actually think and work, rather than how we assumed they would.
Goals & Design Questions
Goal statement: Let users assign relevant views in split screen in a way that supports their workflow. Make split screen behavior consistent, clear, and easy.
Design questions included:
- Must graph view always accompany document view?
- Can the flow for opening / assigning split views be smoother?
- How to reduce visual confusion?
- How important is 3D view to the user?
- What are the consistent rules for assigning windows to splits?
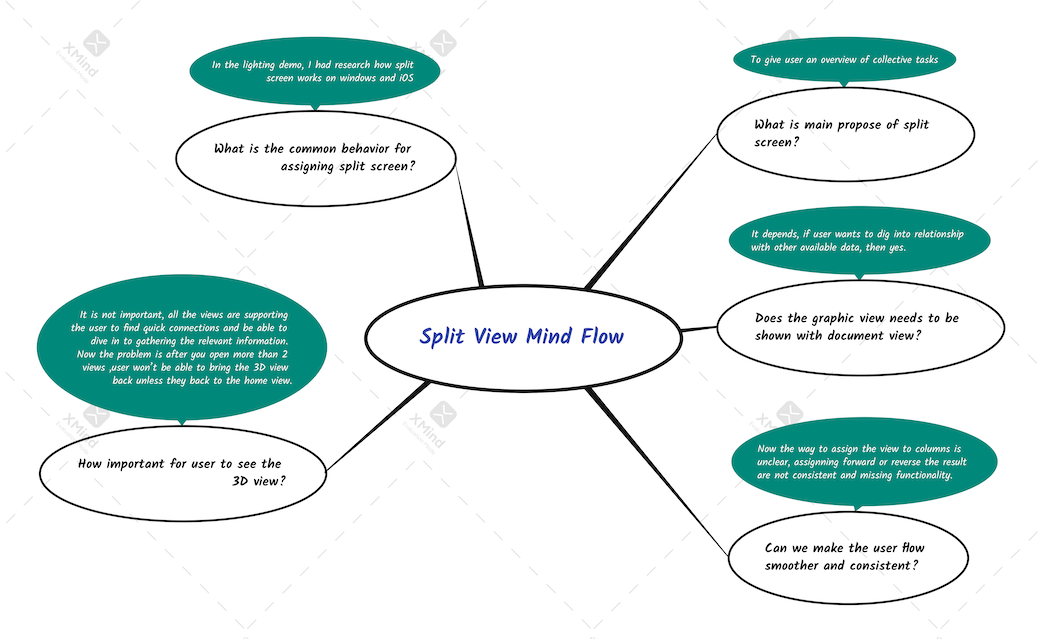
Design Process & Iteration
Mind mapping
At this point, I was curious about how others had already solved the problem of split views. I started by looking at familiar systems — Apple’s split window, Microsoft’s window snapping — and paid close attention to how they handled opening, resizing, and switching between views. I didn’t just study the patterns; I tried them out myself, clicking around, dragging windows, and noticing where the interactions felt natural and where they felt clunky. This hands-on exploration gave me a clearer sense of what “smooth” should feel like, and it helped shape my own expectations for what the split-screen experience in our product ought to deliver
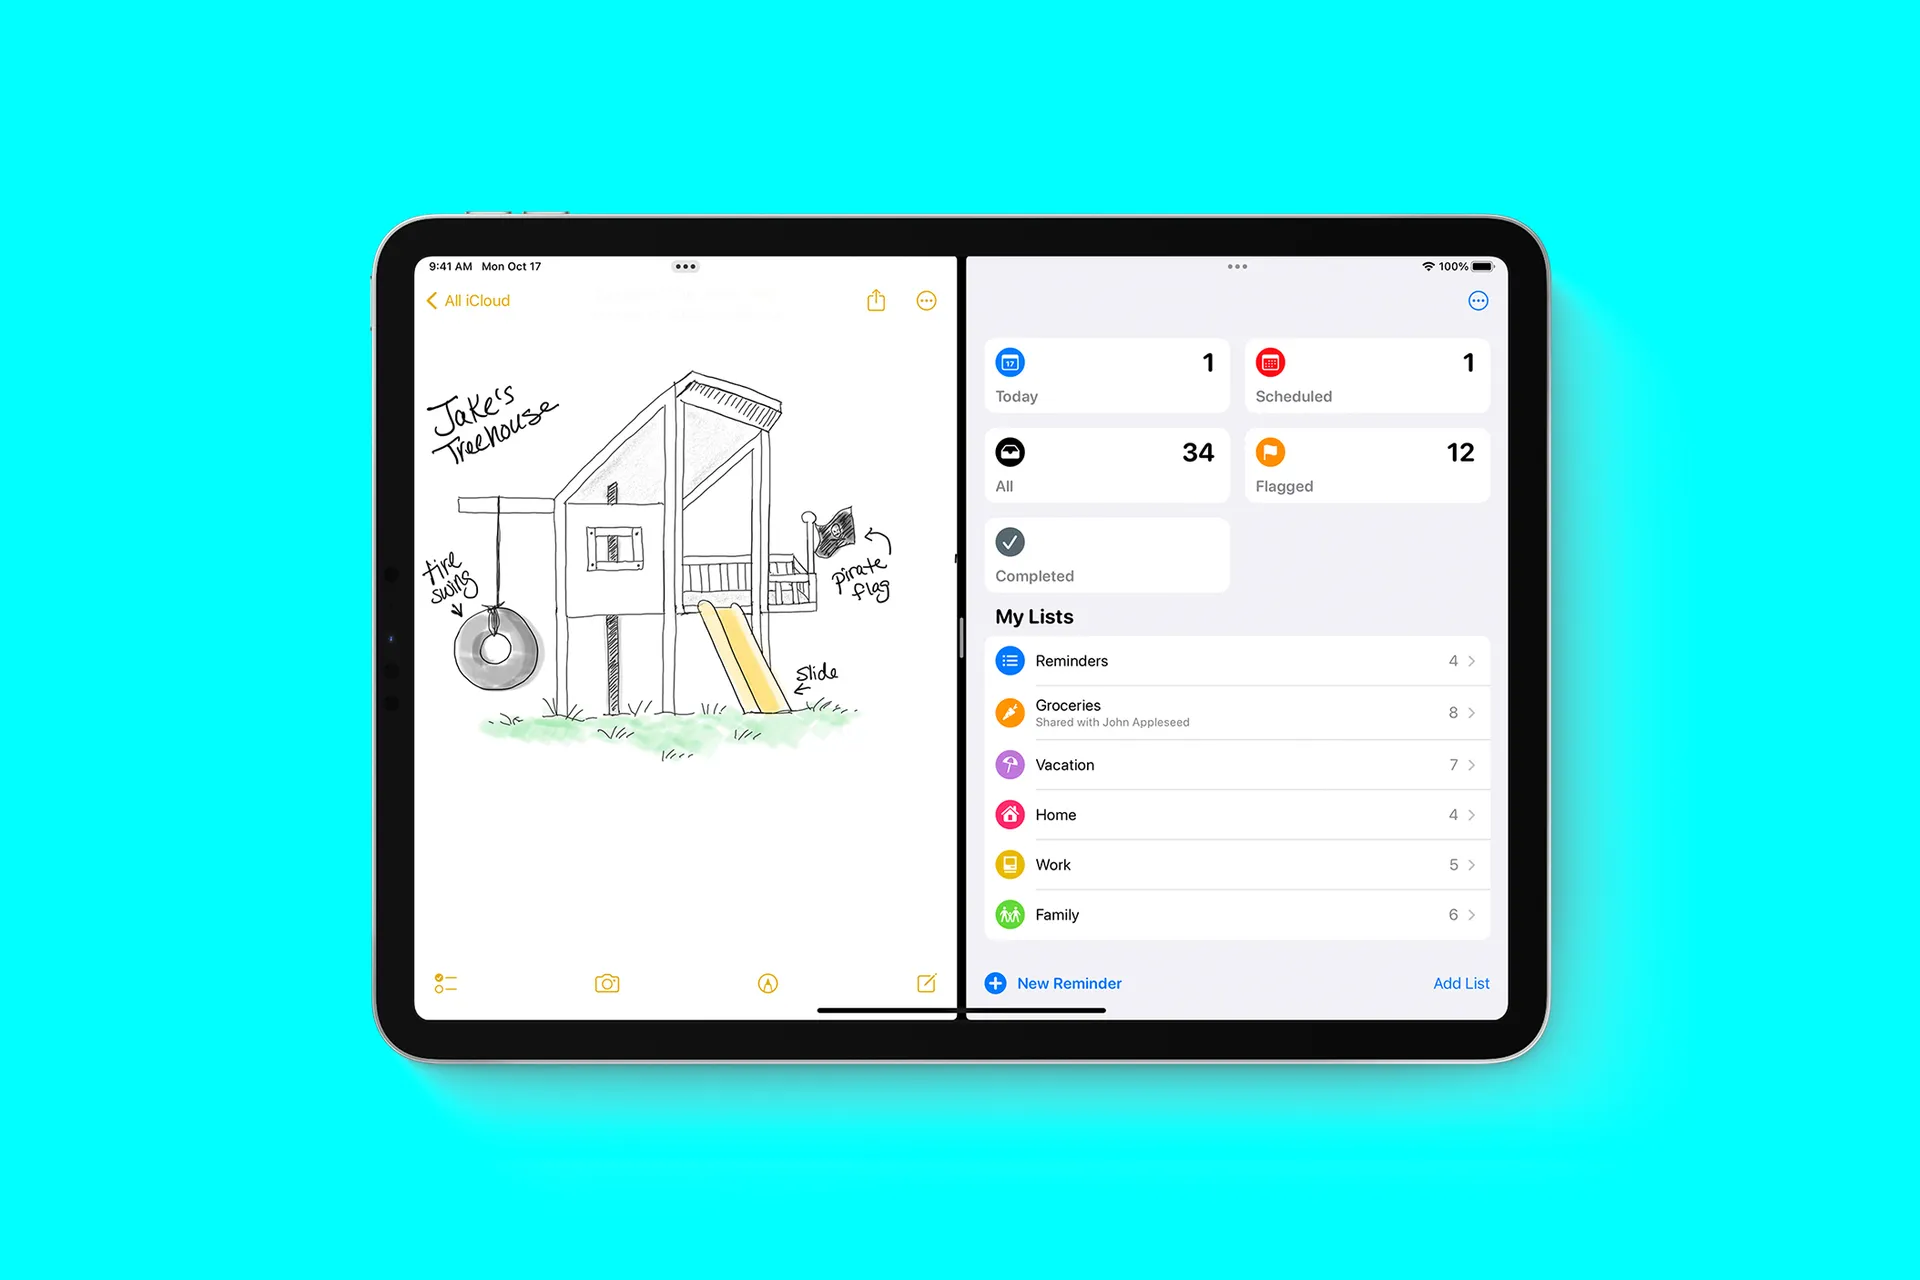
iPad Split view
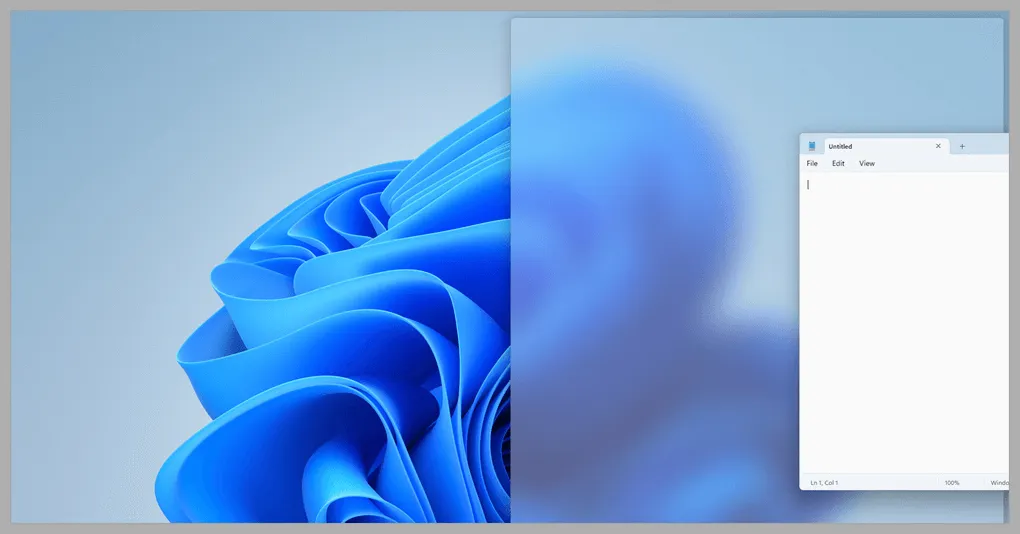
Courtesy of Microsoft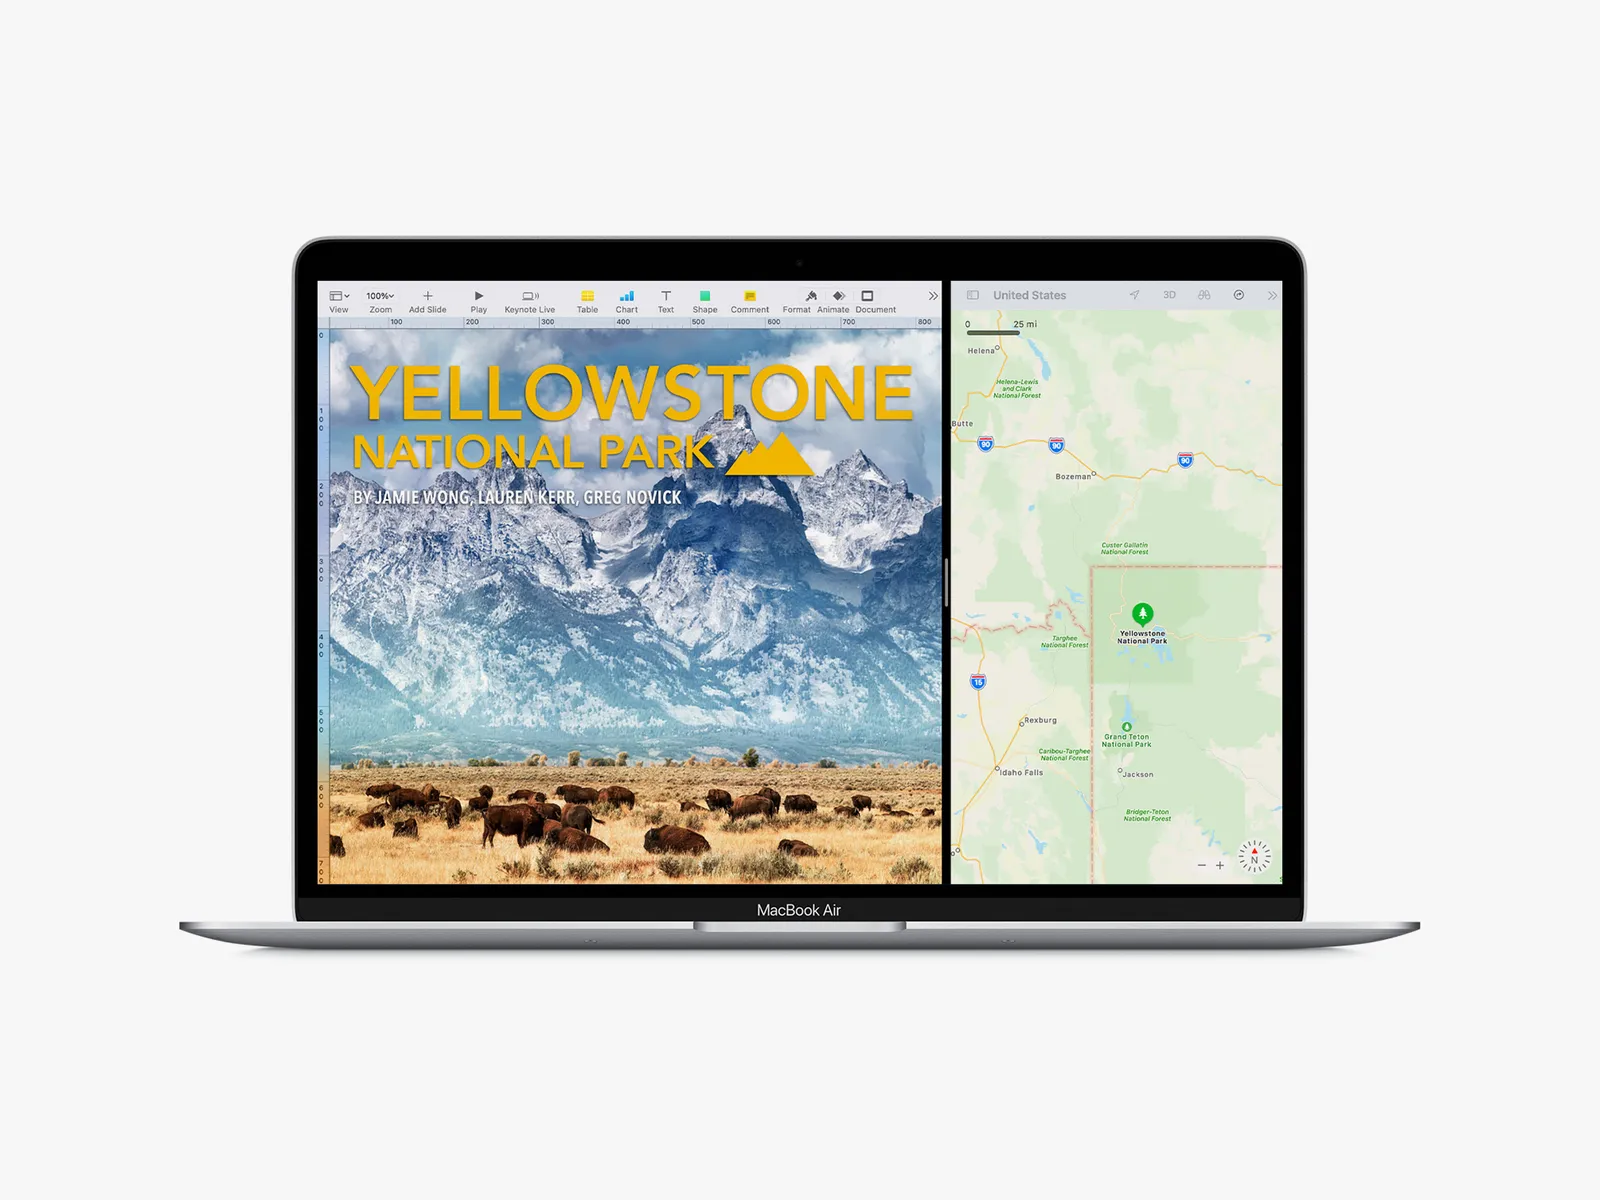
Photograph: Apple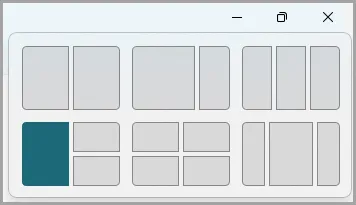
Courtesy of Microsoft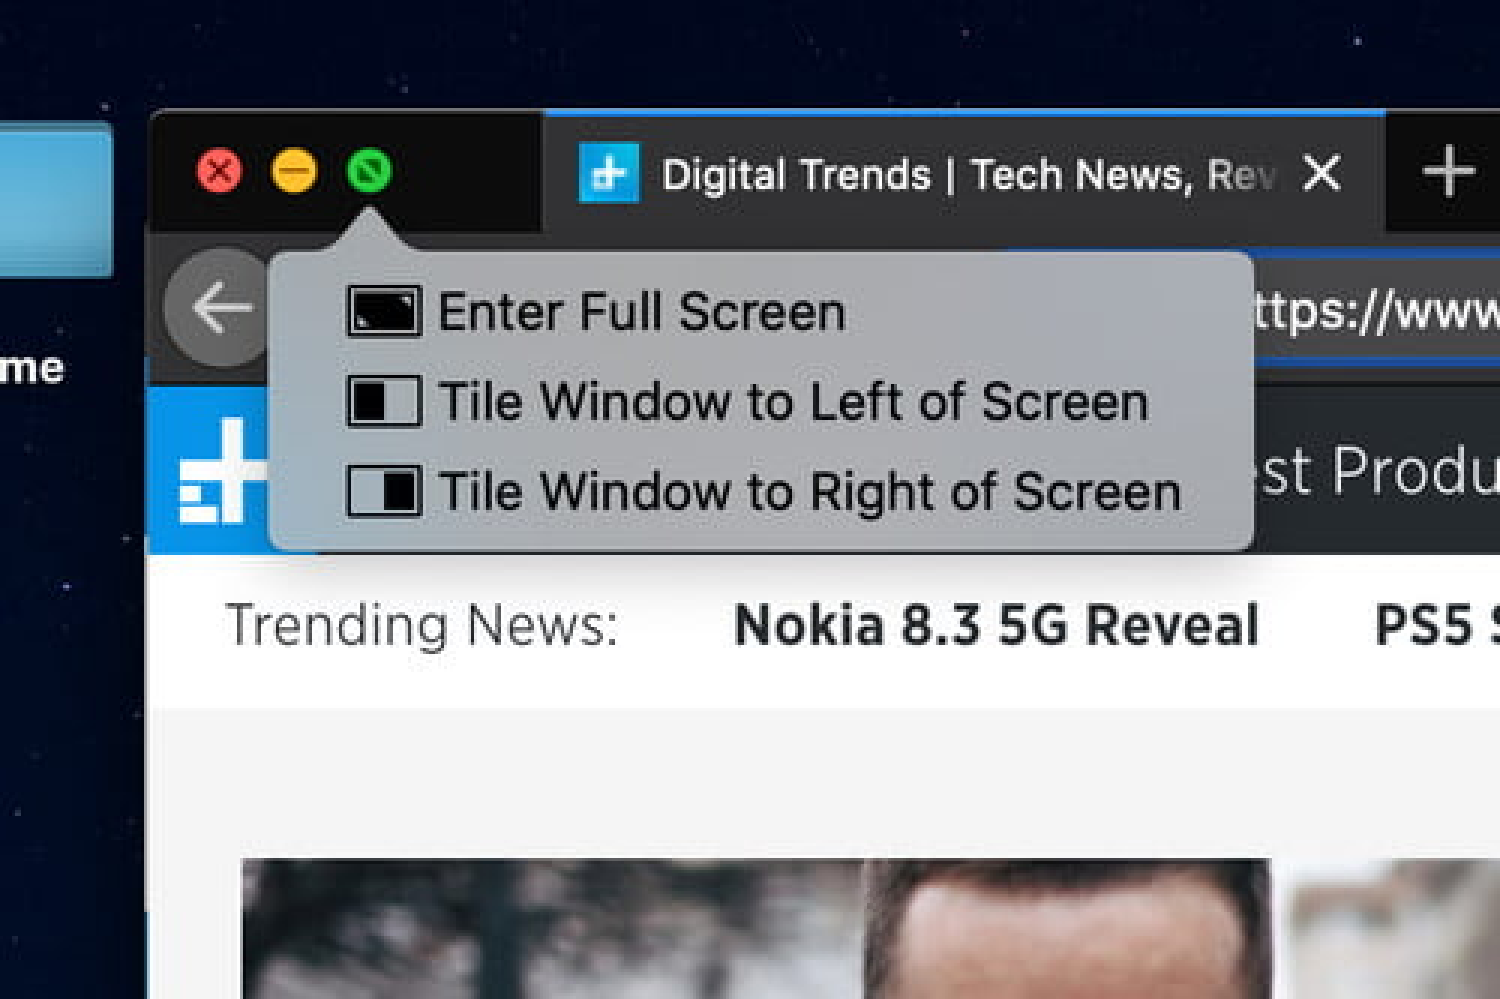
Photograph: AppleSketch / concept iteration
With some reference points in mind, I began sketching out how split views could actually work in our product. My first idea was simple: every new view would just slide into the right-hand side. It sounded neat, but once I played it out with more than two views, it quickly became confusing — the “important” window often ended up tucked away, and users could easily lose track of where they were.
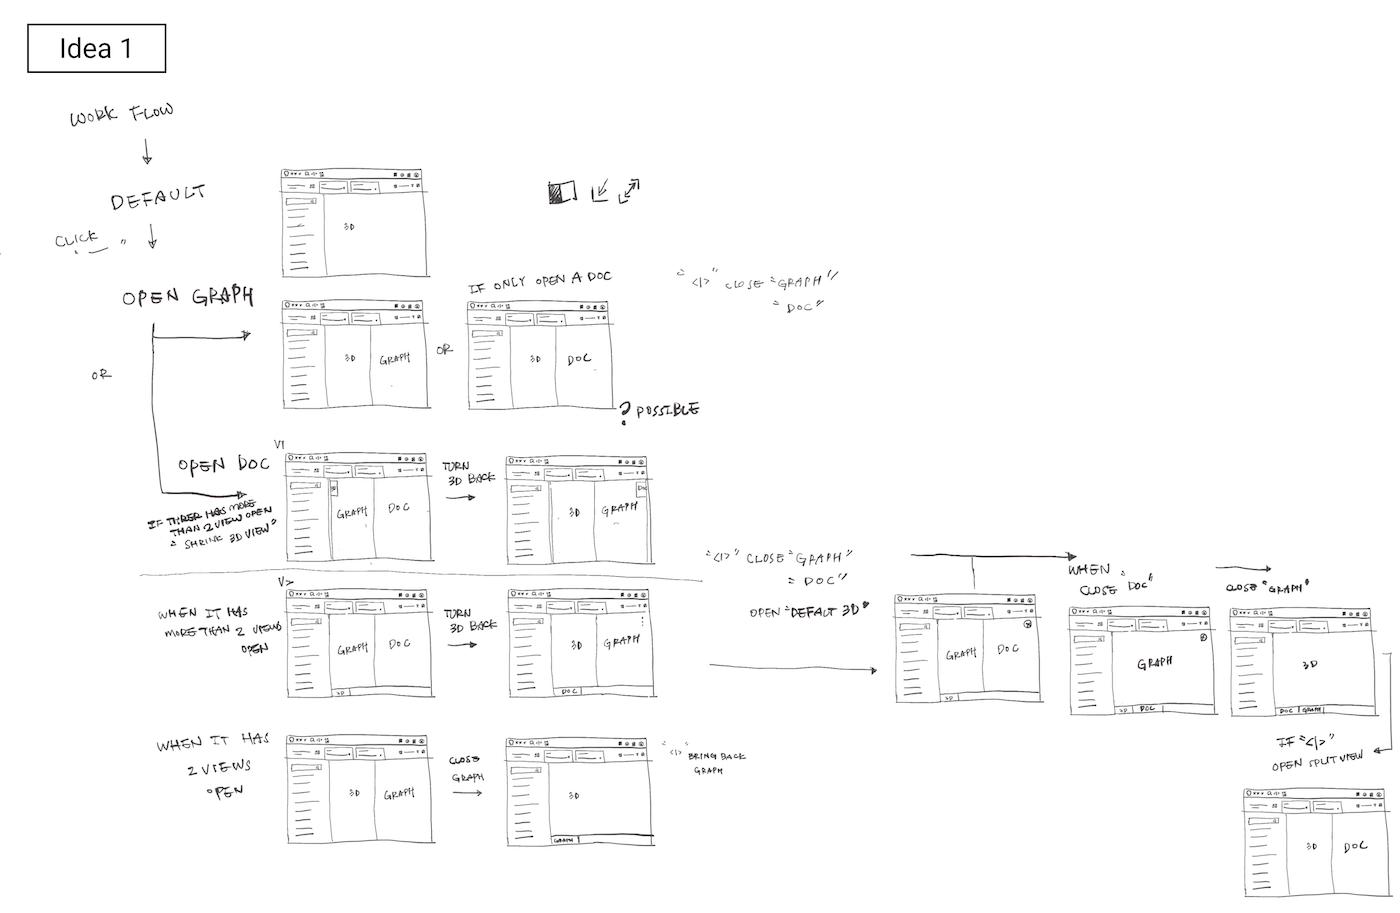
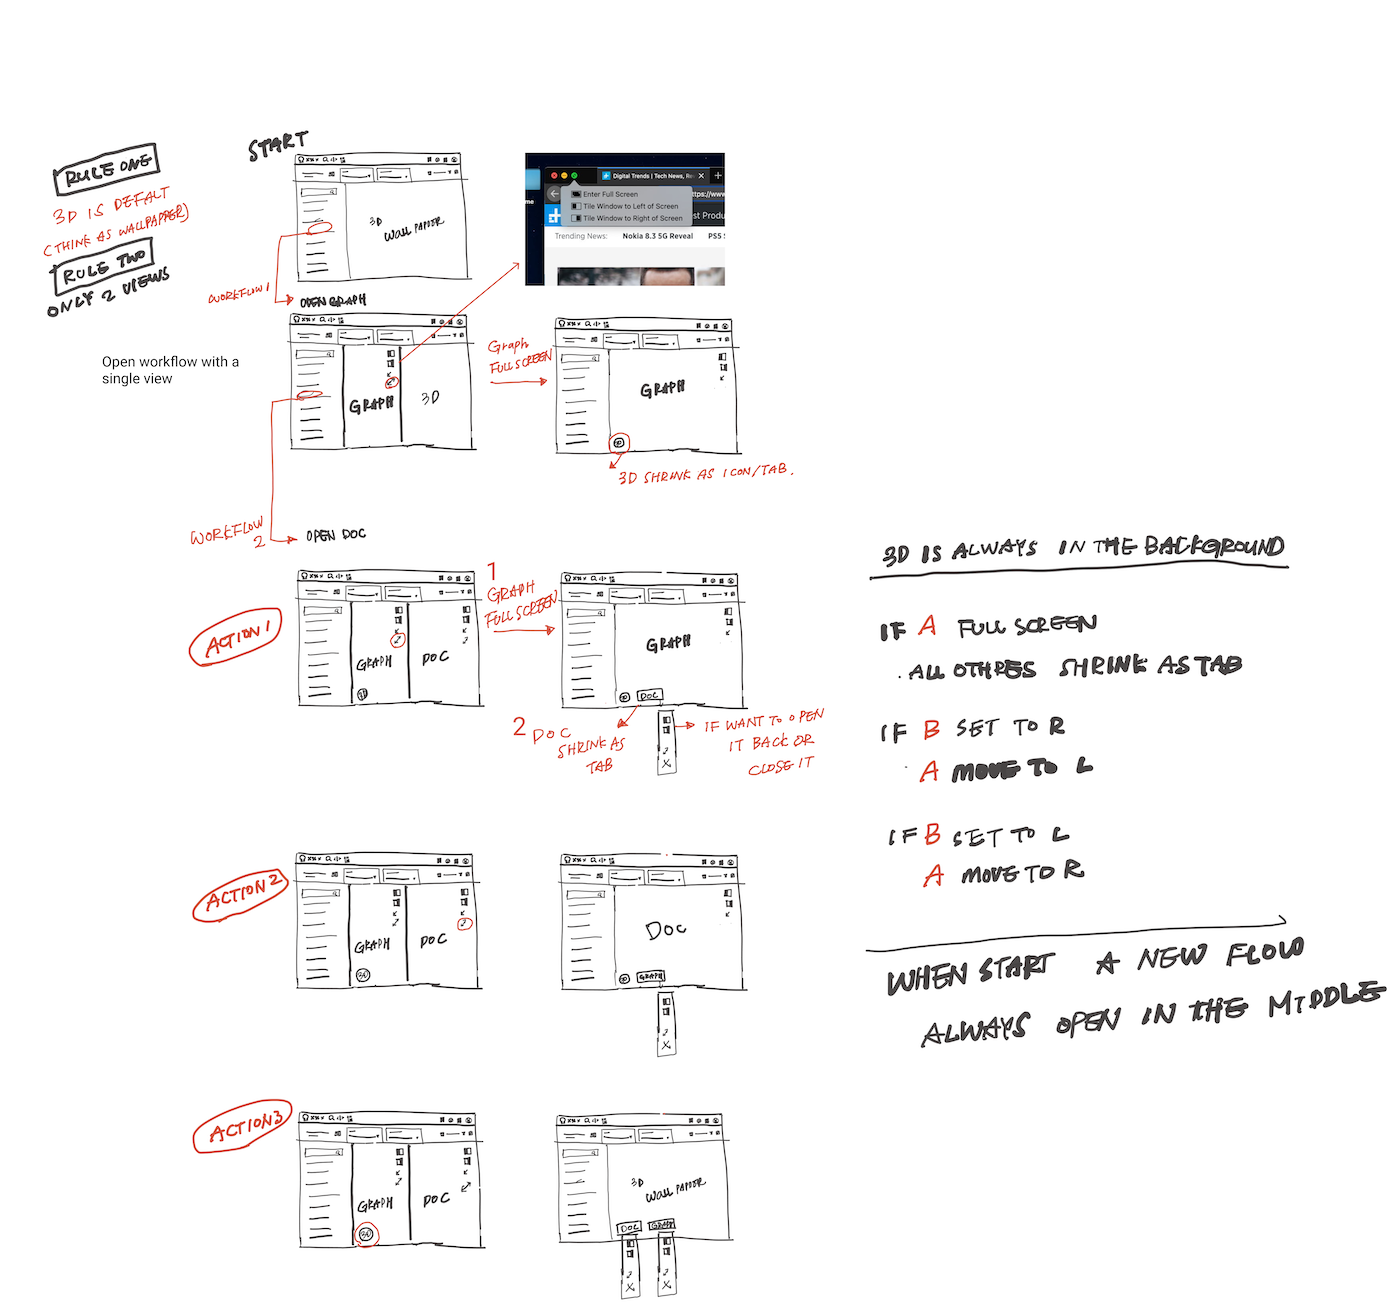
So I tried a different approach, in second idea, taking inspiration from iOS split behaviors. What if the most recently opened view — usually the one the user cares most about , shifted into the primary space, closer to the center or left? That way, emphasis naturally followed the user’s attention.
From there, I explored how to give people more control. Tabs seemed like a natural solution: by clicking a tab, users could decide whether that view should take the left side, the right side, or expand into full screen. To keep things flexible, I designed the 3D view so that when it was brought back to full screen, all other views would neatly collapse into tabs rather than disappear entirely. And to avoid leaving panes blank, I added empty states that offered shortcuts — little reminders of what could be opened next.
Prototype & test with developers
Once the sketches felt coherent, I worked with the developers to bring the ideas to life in a quick prototype. We hooked it up with both front-end and back-end so we could test how the split behavior actually felt in use.
It wasn’t just about proving the concept , the prototype also opened up conversations about trade-offs. For example, how many icons and tool panels could we show before the screen felt cluttered? How do we preserve valuable space when several views are open at once?
Not every detail made it into this case study, but those discussions were essential. They reminded me that design isn’t only about what looks good on paper — it’s about finding the right balance between clarity, usability, and technical feasibility
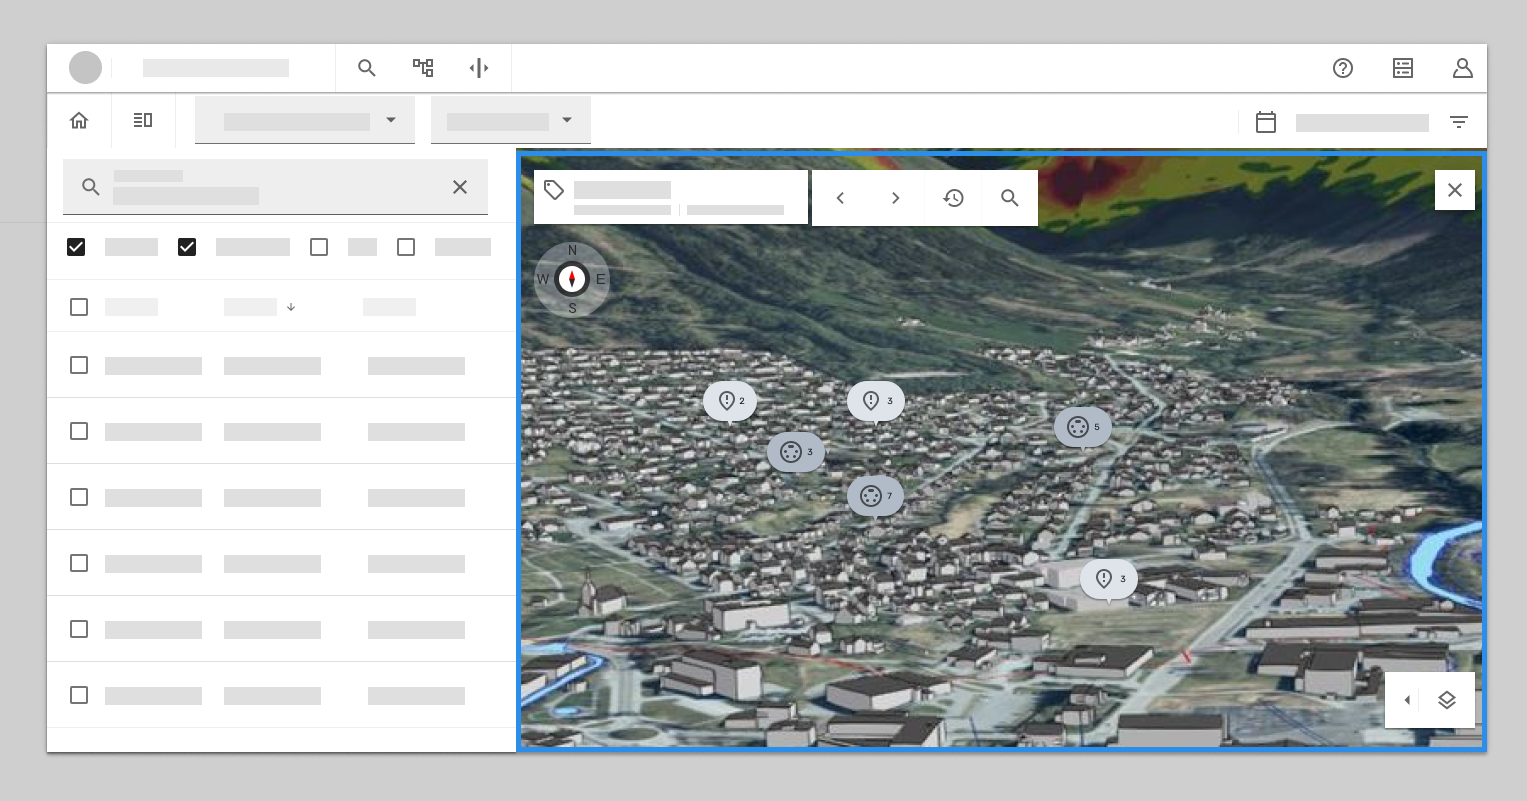
Step 1: user land in 3D view, on the search result find the tag they want to see and right click open context menu.
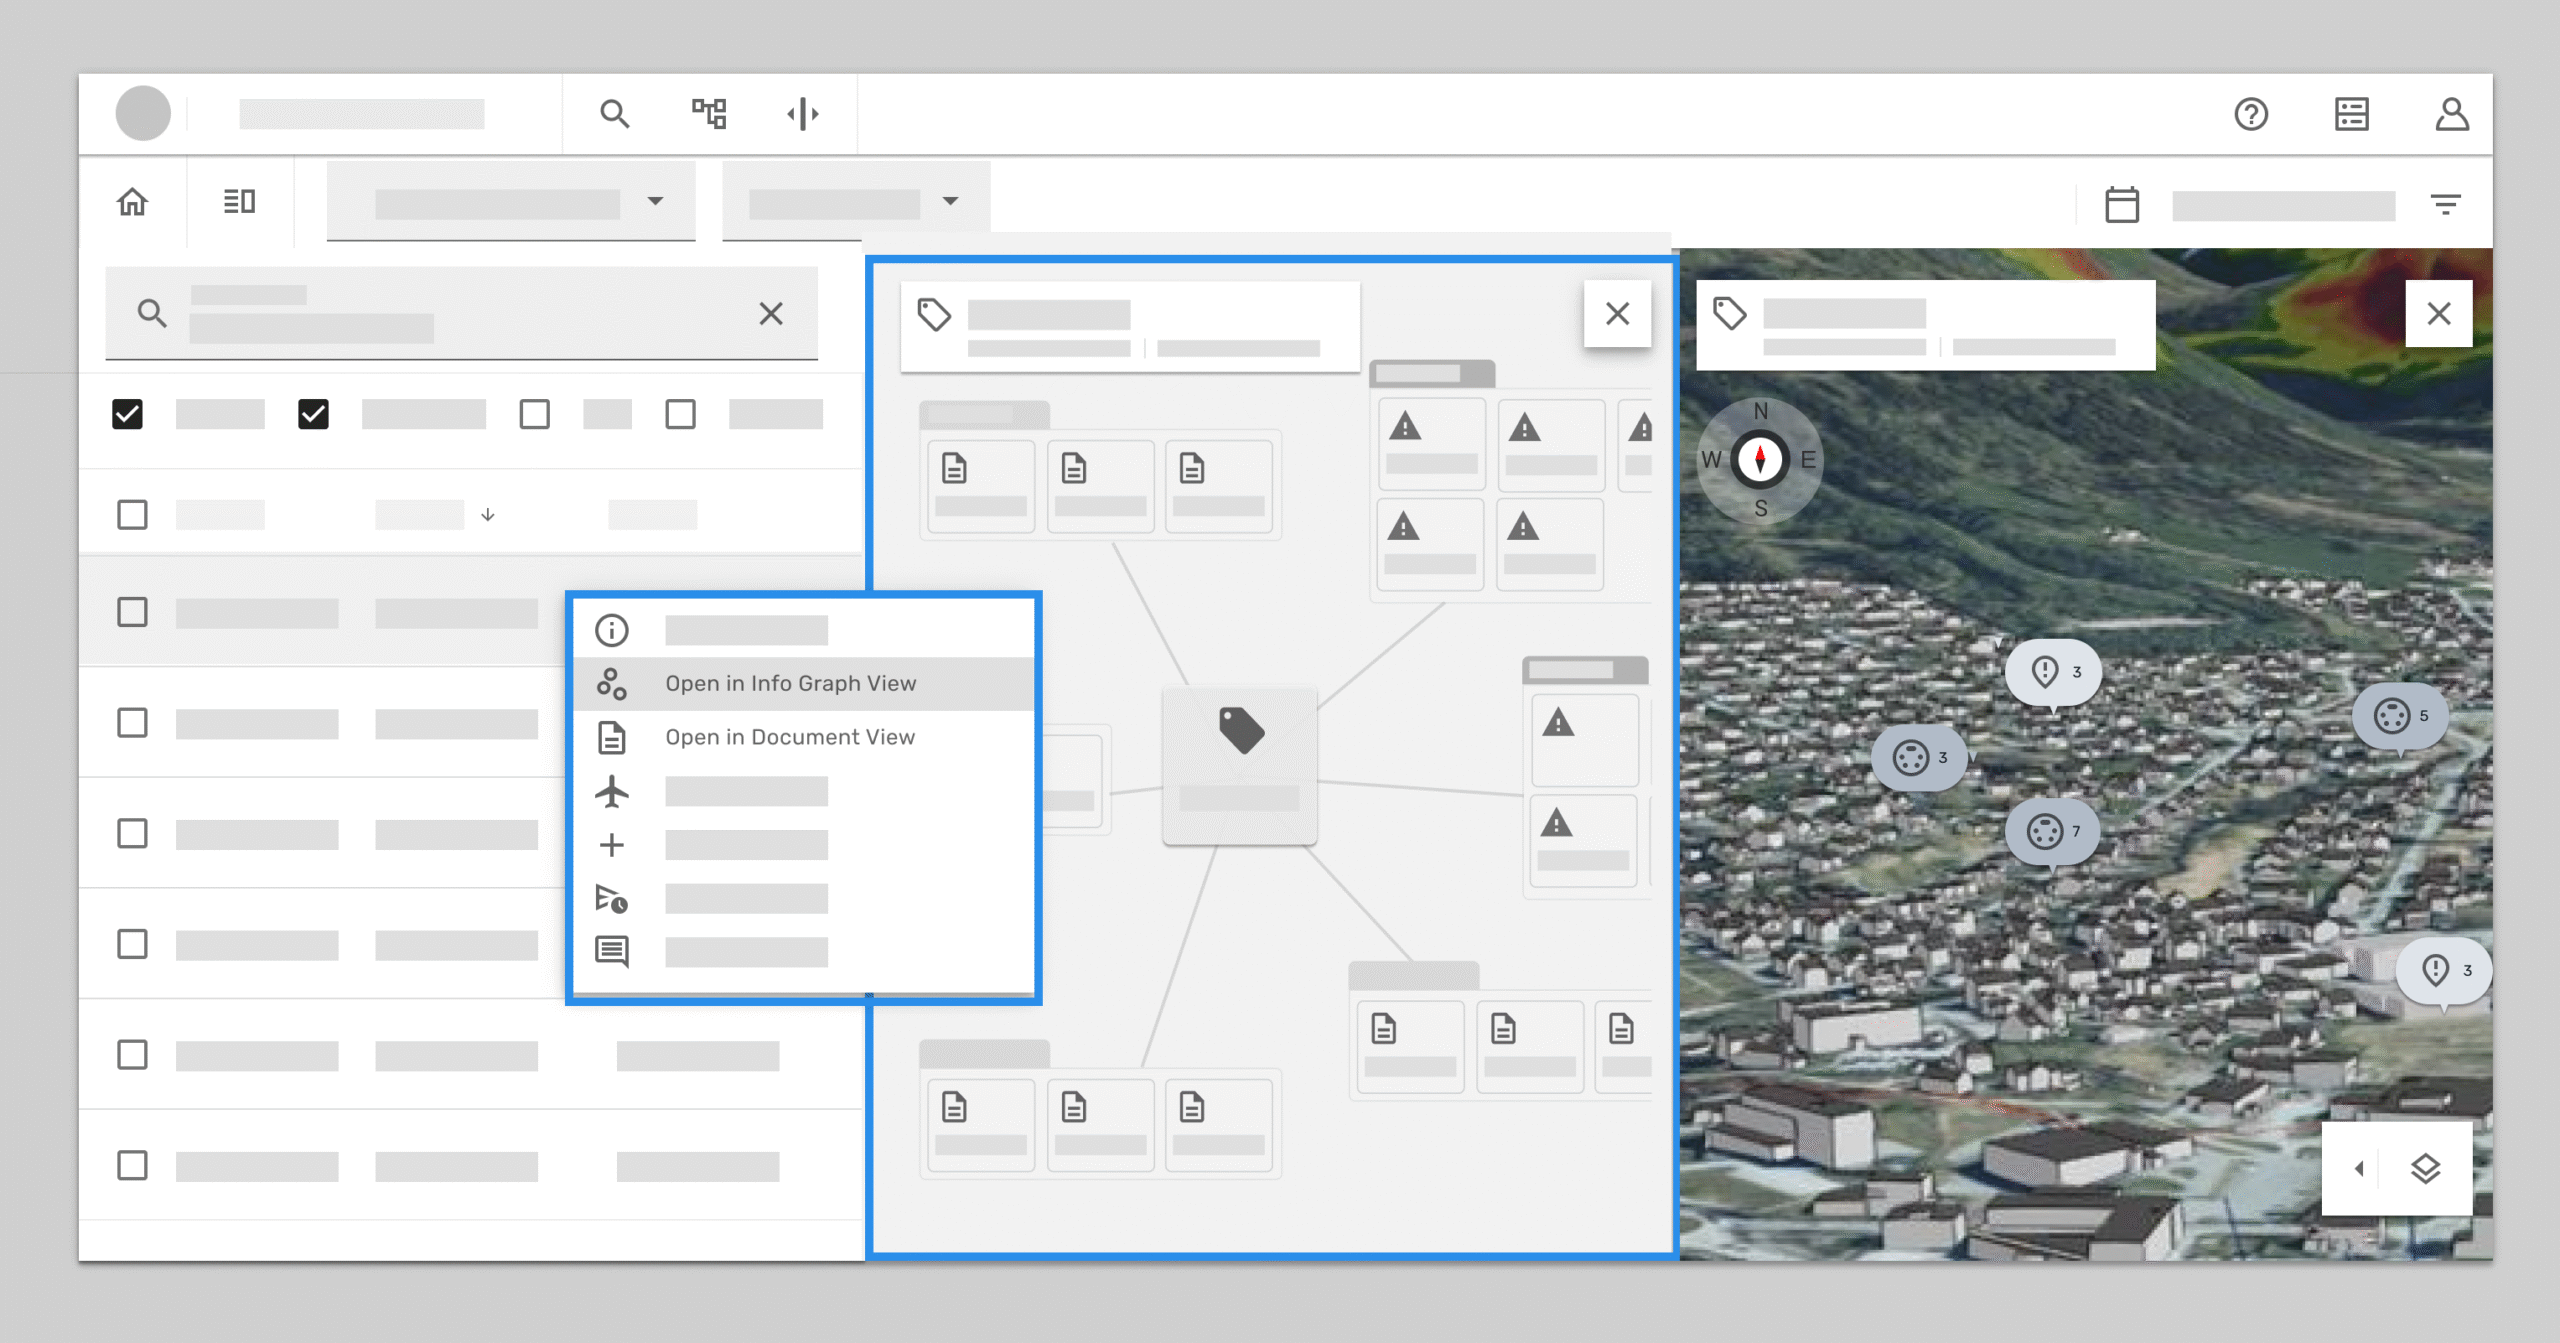
Step 2: From the context menu, the user selects the view they want to open — in this case, the graph view. The system automatically assigns it to the left side, positioning it close to where the user made the selection. This keeps the visual information anchored near the original action, reducing cognitive load and making the transition feel natural.
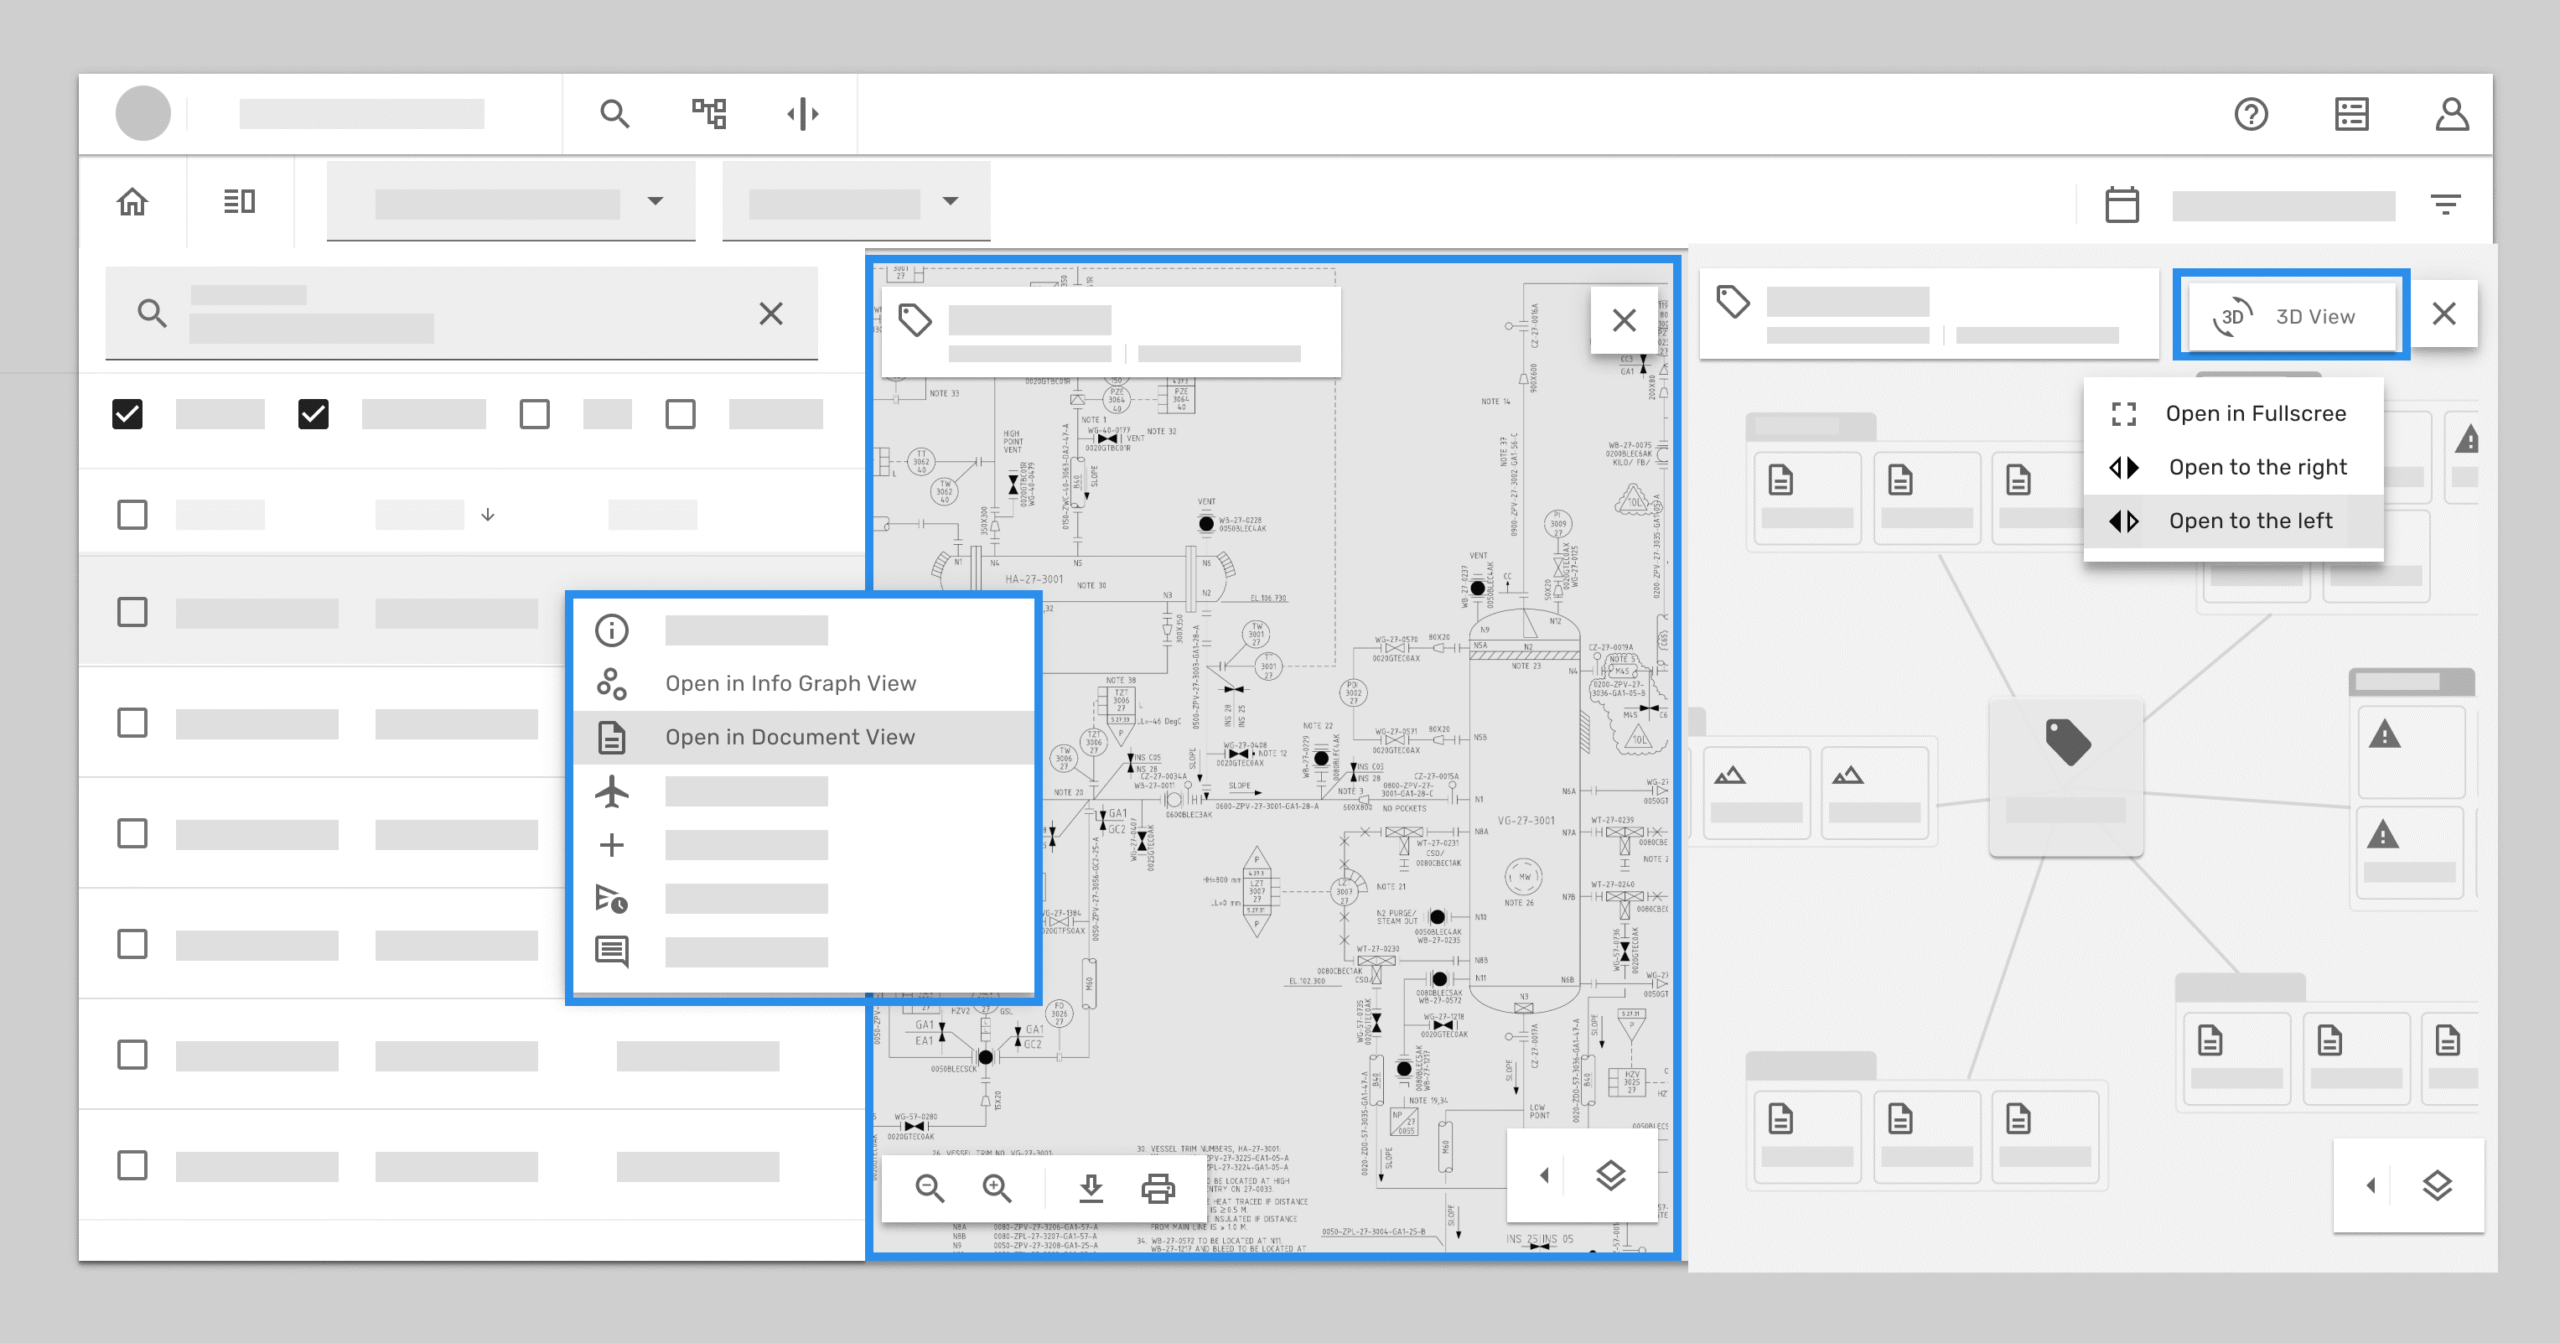
Step 3: When the user chooses to open a document, the system assigns this new view to the center — following the same rule as in Step 2. The previously opened graph view is then shifted to the right, making space for the document in the primary position. At the same time, the 3D view is minimized into a tab, so it remains accessible without cluttering the workspace.
If click 3D tab, it will have 3 options: open to the right , open to the left , or open as full screen.
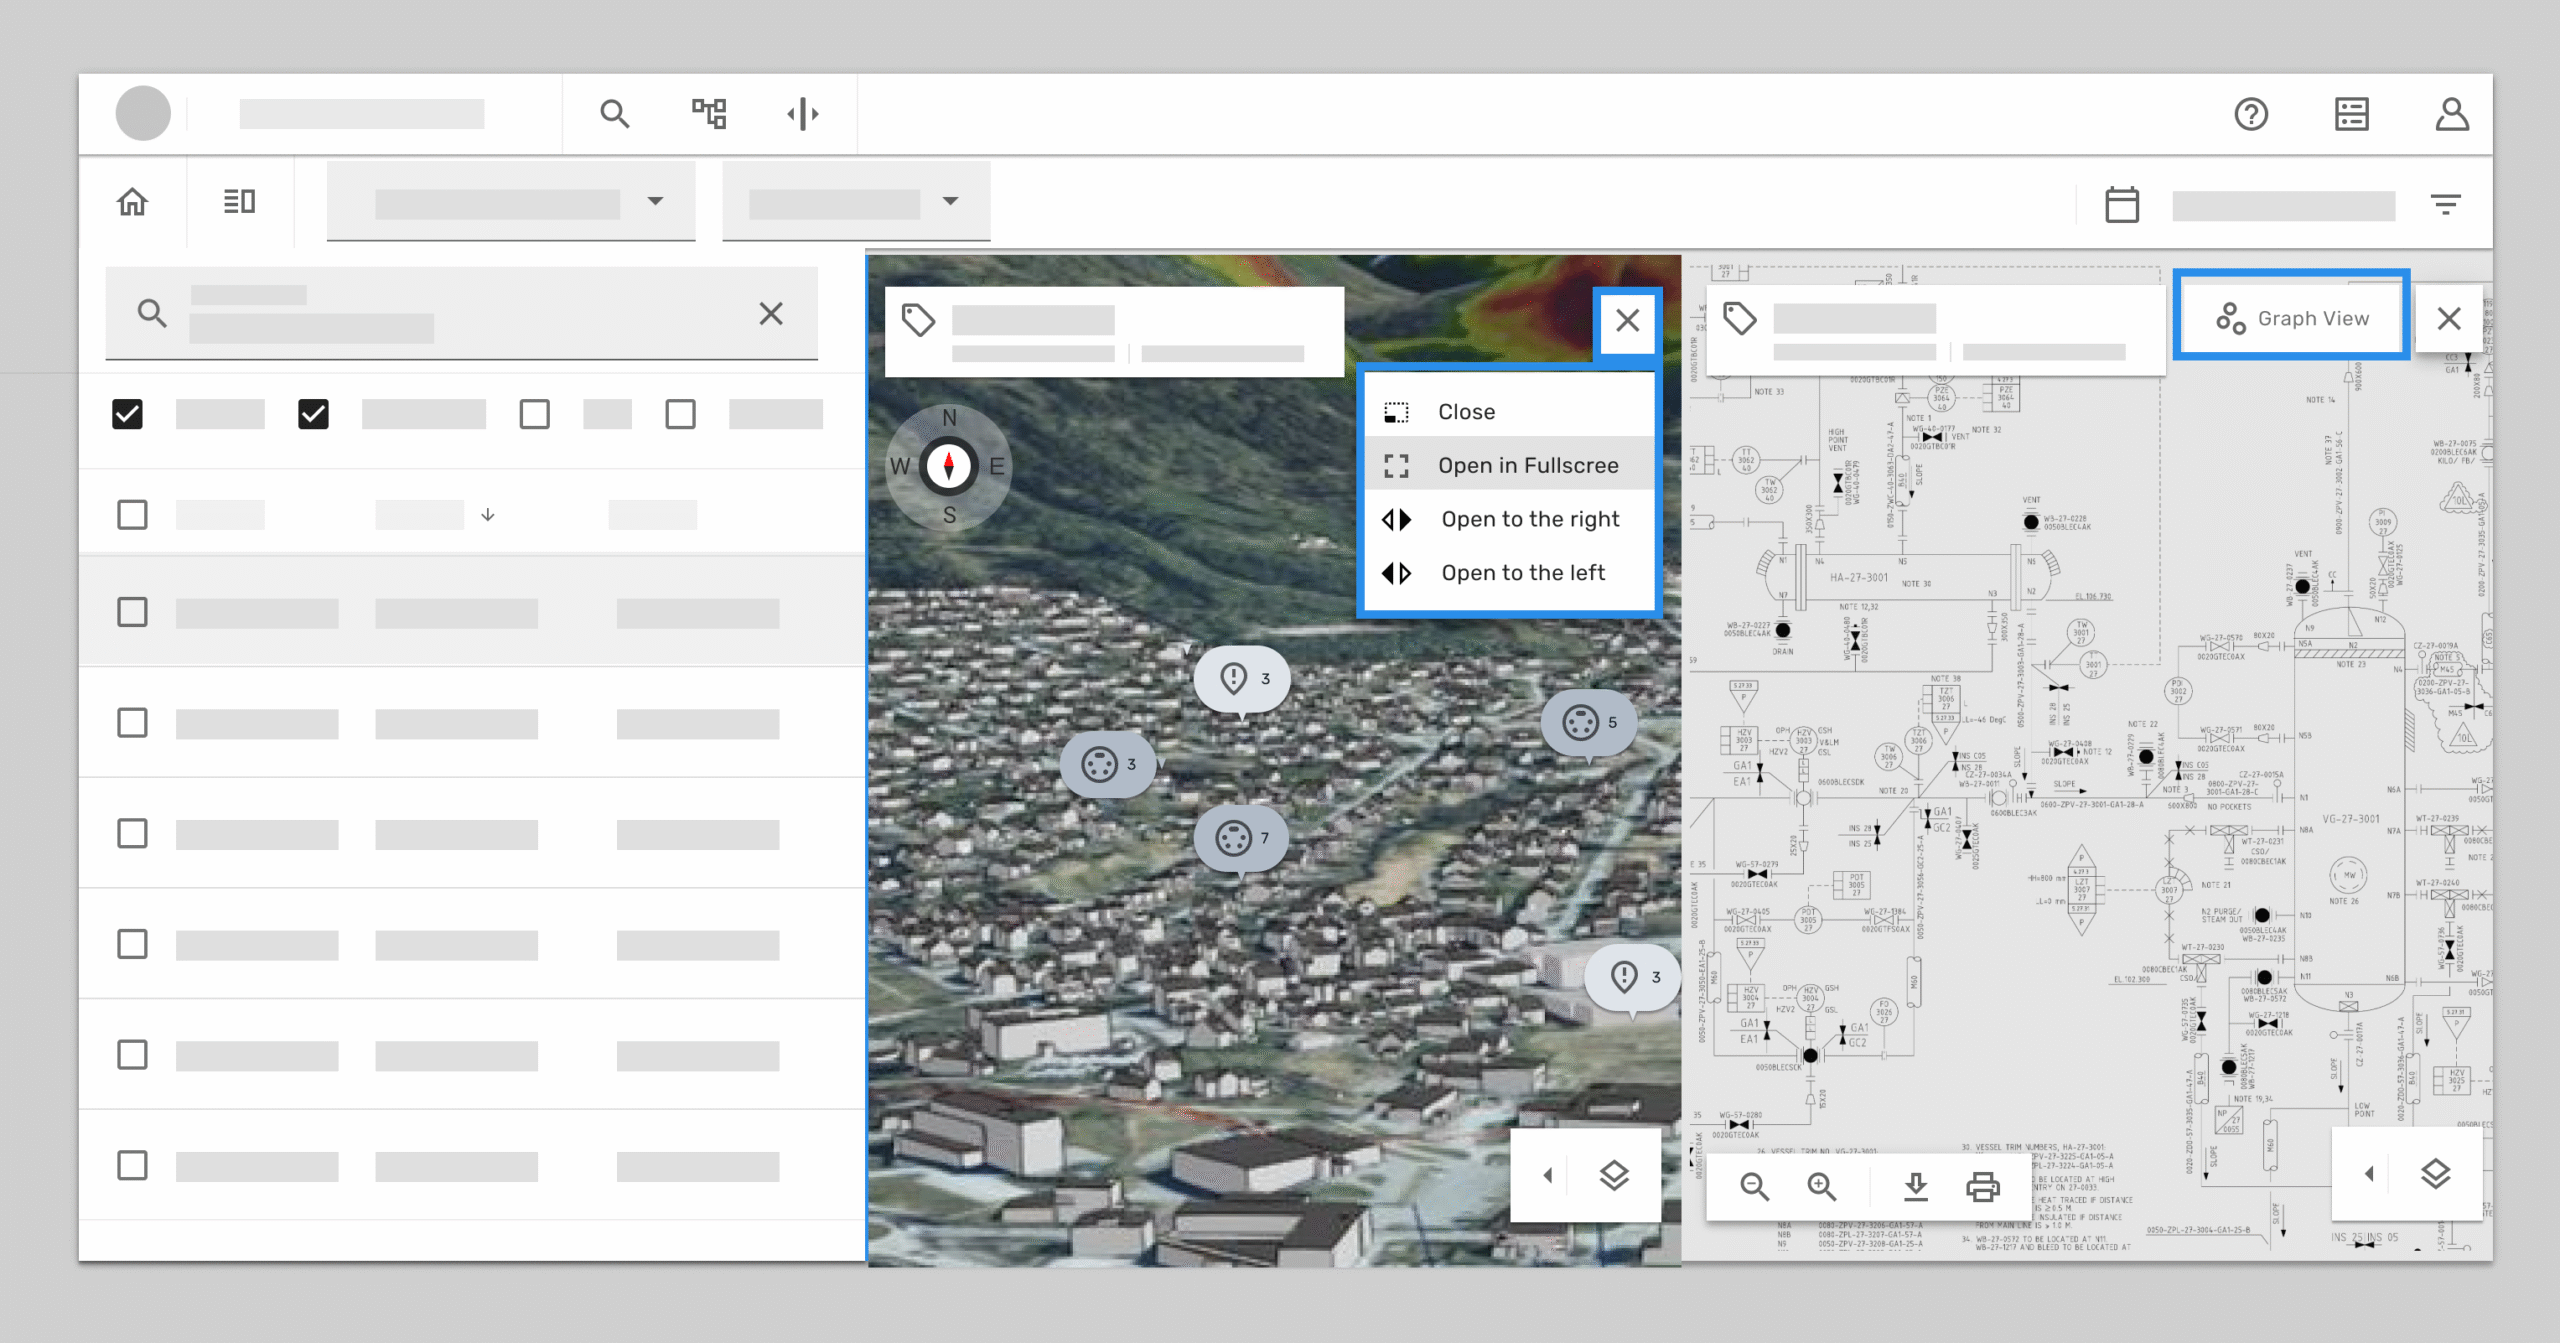
Step 4: Building on Step 3, if the user chooses to open the 3D view on the left side, the previous screens are pushed toward the right.
During testing, however, I uncovered a major flaw in this design. My initial assumption was that the interface should always preserve a strict hierarchy: the most important view stays in the center, while secondary views get pushed to the right. In practice, users behaved differently. They often preferred to replace the less important view — in this case, the document — while keeping the graph view visible. Unfortunately, in our prototype, the graph view was hidden instead, which caused confusion and frustration.
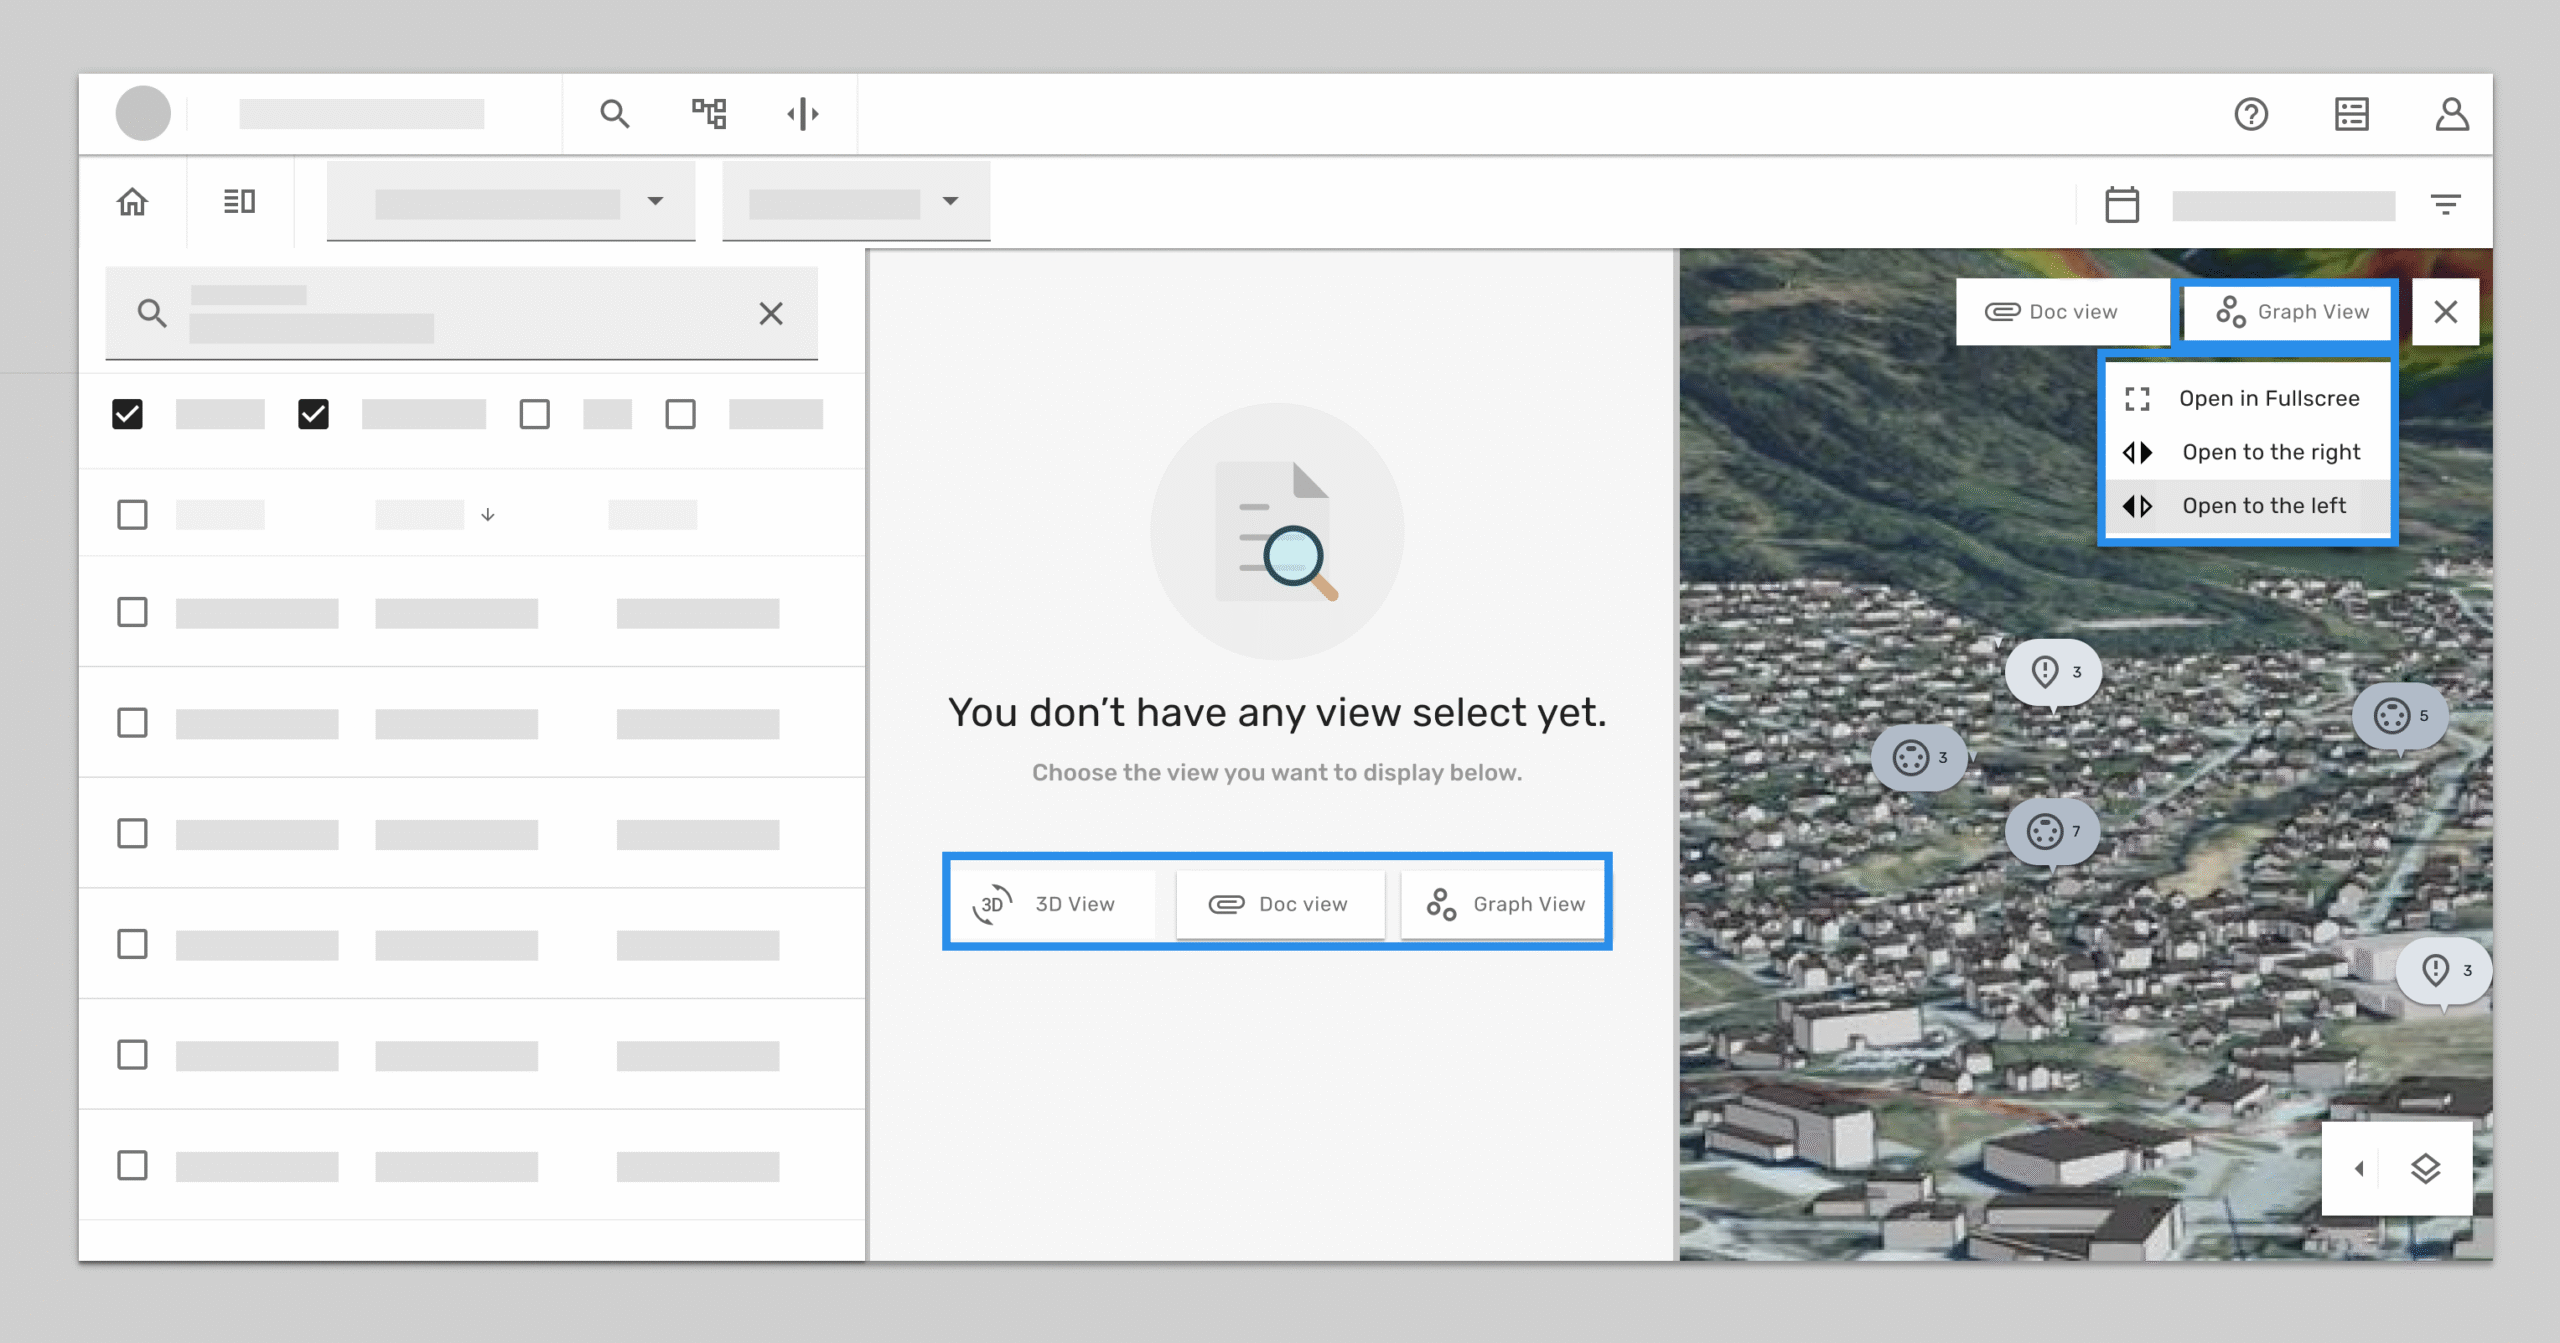
We quickly iterated on the design to better match user expectations. Instead of enforcing a fixed hierarchy, we allowed users to choose which screen to replace. The selected view would be swapped in, while the replaced one was minimized into a tab so it stayed accessible. We tested this approach with users again and also introduced an empty state for workflows where two split-screen areas were set as the default.
Documentation & Learning
To wrap up, I documented not only how the split layouts functioned, but also the reasoning behind them. The core idea was simple: give users control. Split layouts allow them to toggle the visibility of components, assign views to different areas, and manage their limited screen space more effectively. Depending on the workflow, splits could be vertical or horizontal, making the layout flexible enough to adapt to different contexts.
-
rationale:
-
Split layouts let users toggle component visibility, allocate views, and manage screen real estate.
-
Splits can be vertical or horizontal depending on the use case.
-
Key Takeaways
Looking back, there were several key lessons from this process:
-
- Collaboration mattered as much as the design itself, a concept that looked elegant in Figma still had to be feasible for developers to implement and acceptable to stakeholders.
- Vision needed to be balanced with reality. Technical constraints and resource limits sometimes meant choosing the practical path over the ideal.
- The most important UX decisions often happened at the component and flow level, not in glossy visuals.
- In a fast-paced, agile setting, “quick and dirty” prototypes were invaluable for sparking conversations and moving the design forward.
- Simplicity was a strength. In a complex industrial product, the principle of K.I.S.S. (“keep it simple, stupid”) turned out to be the best guide.
-
Through user testing and interviews, combined with continuous feedback from product owners, domain experts, and stakeholders, we were able to keep the design grounded in real user needs and practical workflows.

Object-Oriented UX (OOUX) for digital twins: insights to support scalable 3D view

Making 3D usable: OOUX finding from isolate & highlight features

Designing SaaS for digital twin: how discovery shaped the solution
(47) 41 33 16 51
Reach Me By Phone
Email Me
Rølivegen 367, Steinkjer, 7718, Trøndelag
📍 Based in Norway