
NTE User Portal / Dashboard — empowering energy insights
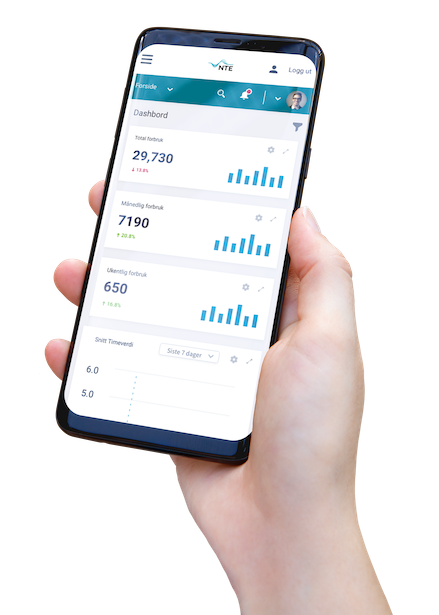
NTE is one of Norway’s major electricity producers. They wanted to build a user portal for their customers (likely large consumers, brokers, or internal stakeholders) to self‐serve, explore power usage data, and make decisions based on actionable insights.
Project type: Enterprise dashboard / user portal
Client: NTE (Nord-Trøndelag Elektrisitetsverk)
My role: Dashboard & UI design, prototyping, data visualization, navigation optimization
Tools: Adobe XD, Illustrator, Photoshop
Timeline: ~3–4 months, 2020

The core challenge
-
Legacy systems delivered raw data in silos, with poor usability.
-
Users struggled to make sense of numbers without visualization.
-
Navigation was confusing; users had to hunt across menus and tables.
-
The portal needed to look professional and trustworthy, to match NTE’s brand.
Primary Goal
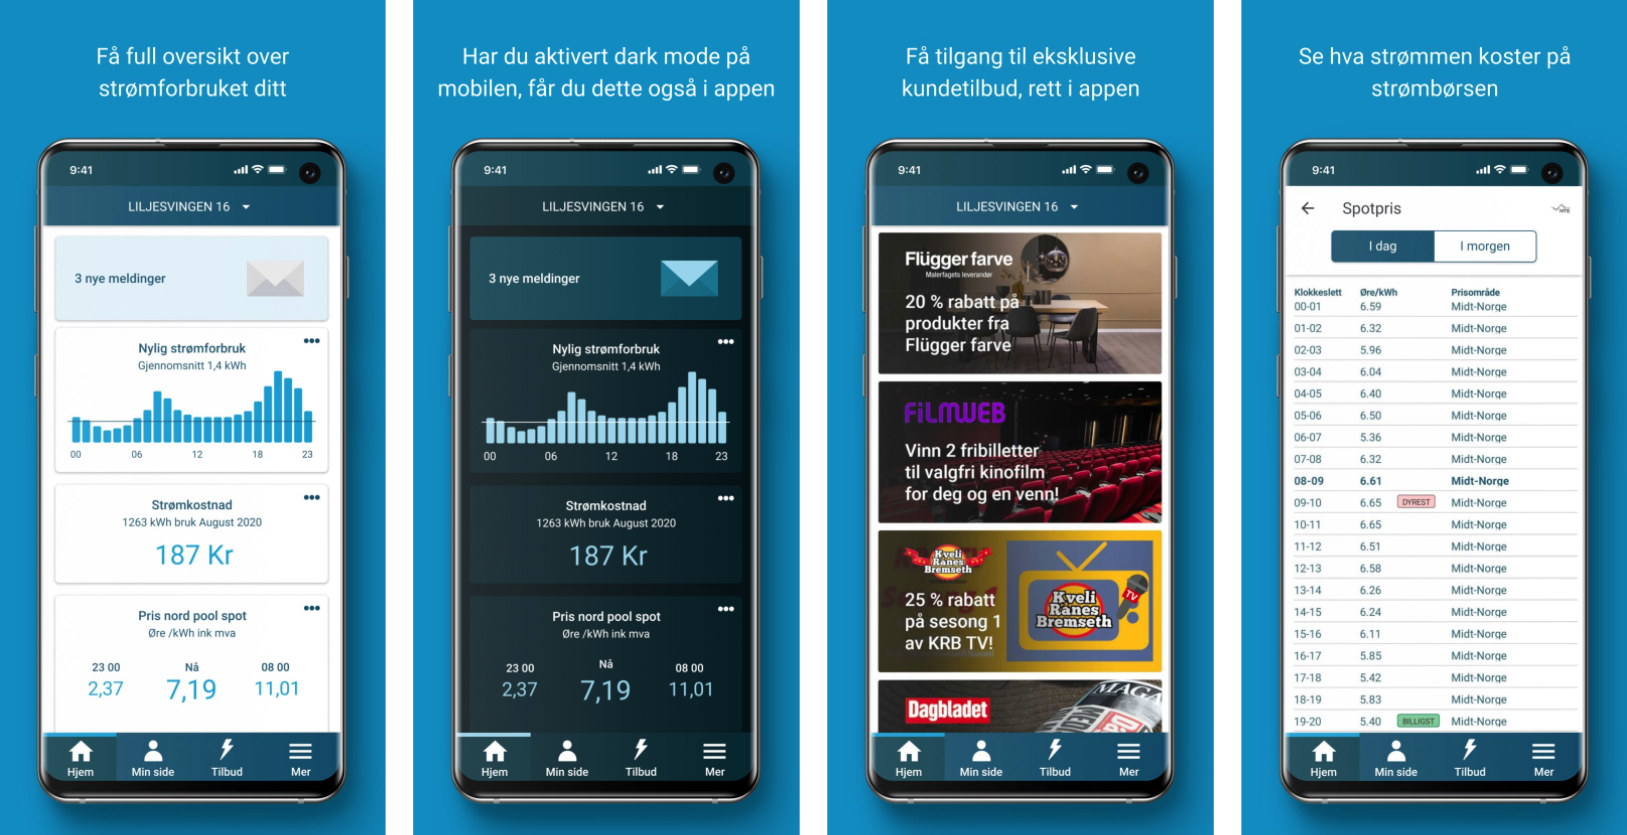
3. Create a modern, intuitive dashboard that surfaces key metrics, simplifies navigation, and makes complex energy data digestible visually
Scope & Responsibilities
Scope of work included:
-
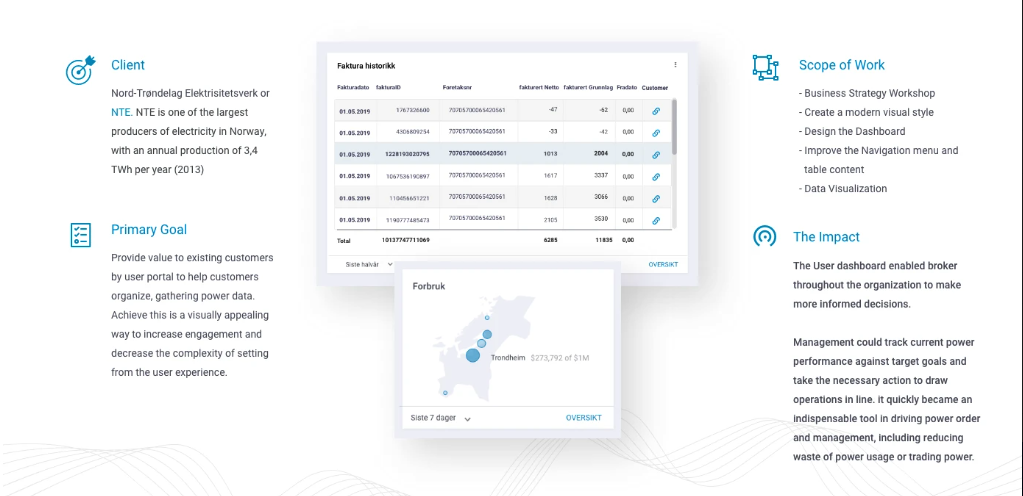
Leading a business strategy workshop with stakeholders to identify goals, KPIs, user types, and pain points.
-
Defining a visual style / design system aligned with NTE’s brand identity (colors, typography, iconography)
-
Designing the dashboard layout, including charts, stats panels, and data modules
-
Improving the navigation menu and table content for clarity and hierarchy
-
Crafting data visualizations (bar charts, line charts, maps) that help users quickly interpret energy usage trends.
-
Prototyping and iterating screens with usability feedback and handoff for development
Please click full interation prototype in Behence
Team/Role
Dashboard design/ prototype : Yu-Ting,Chuang
Development : Marcus Rognes
The Impact
Workshop
Key takeaway
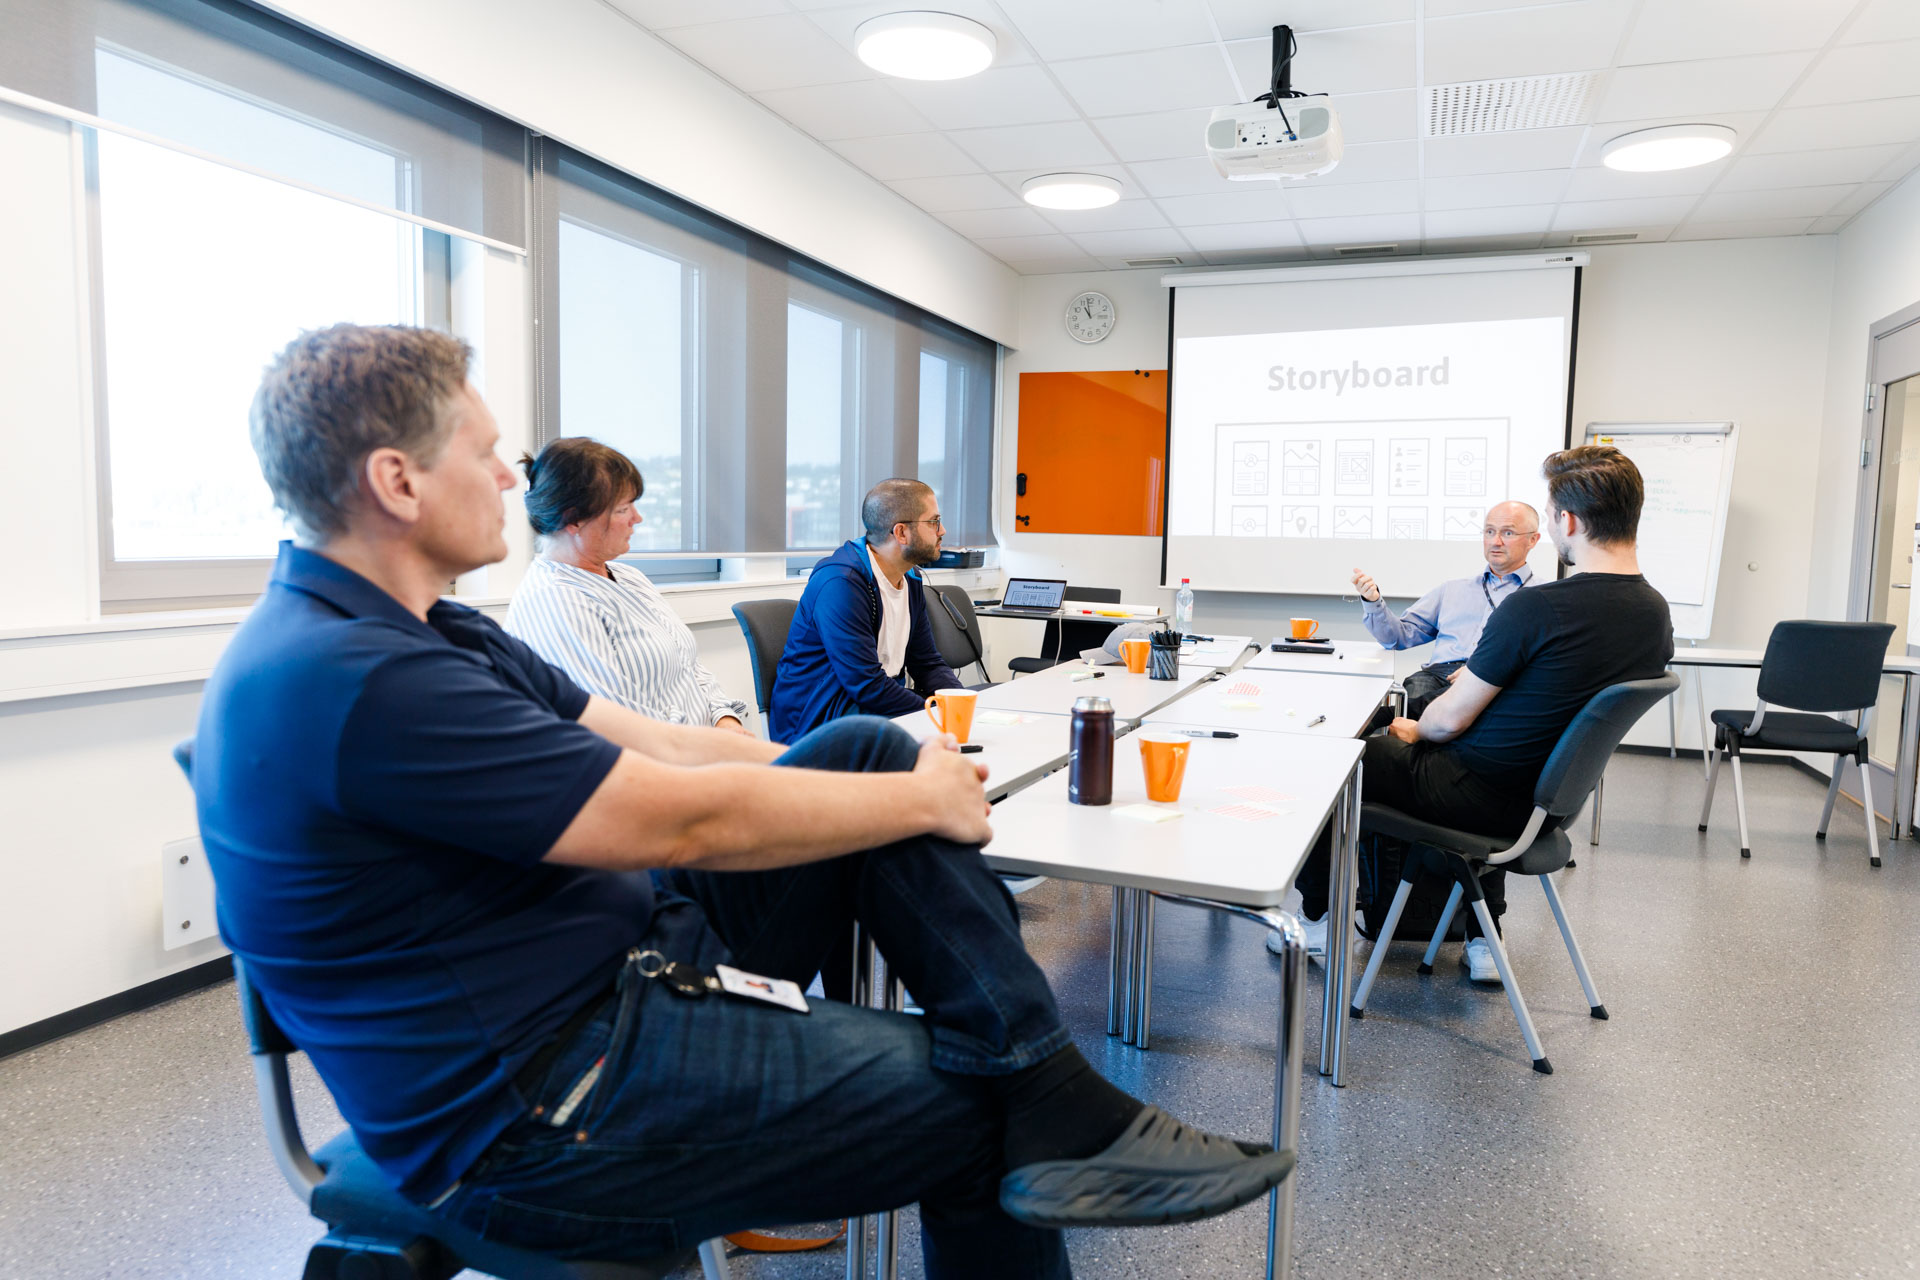
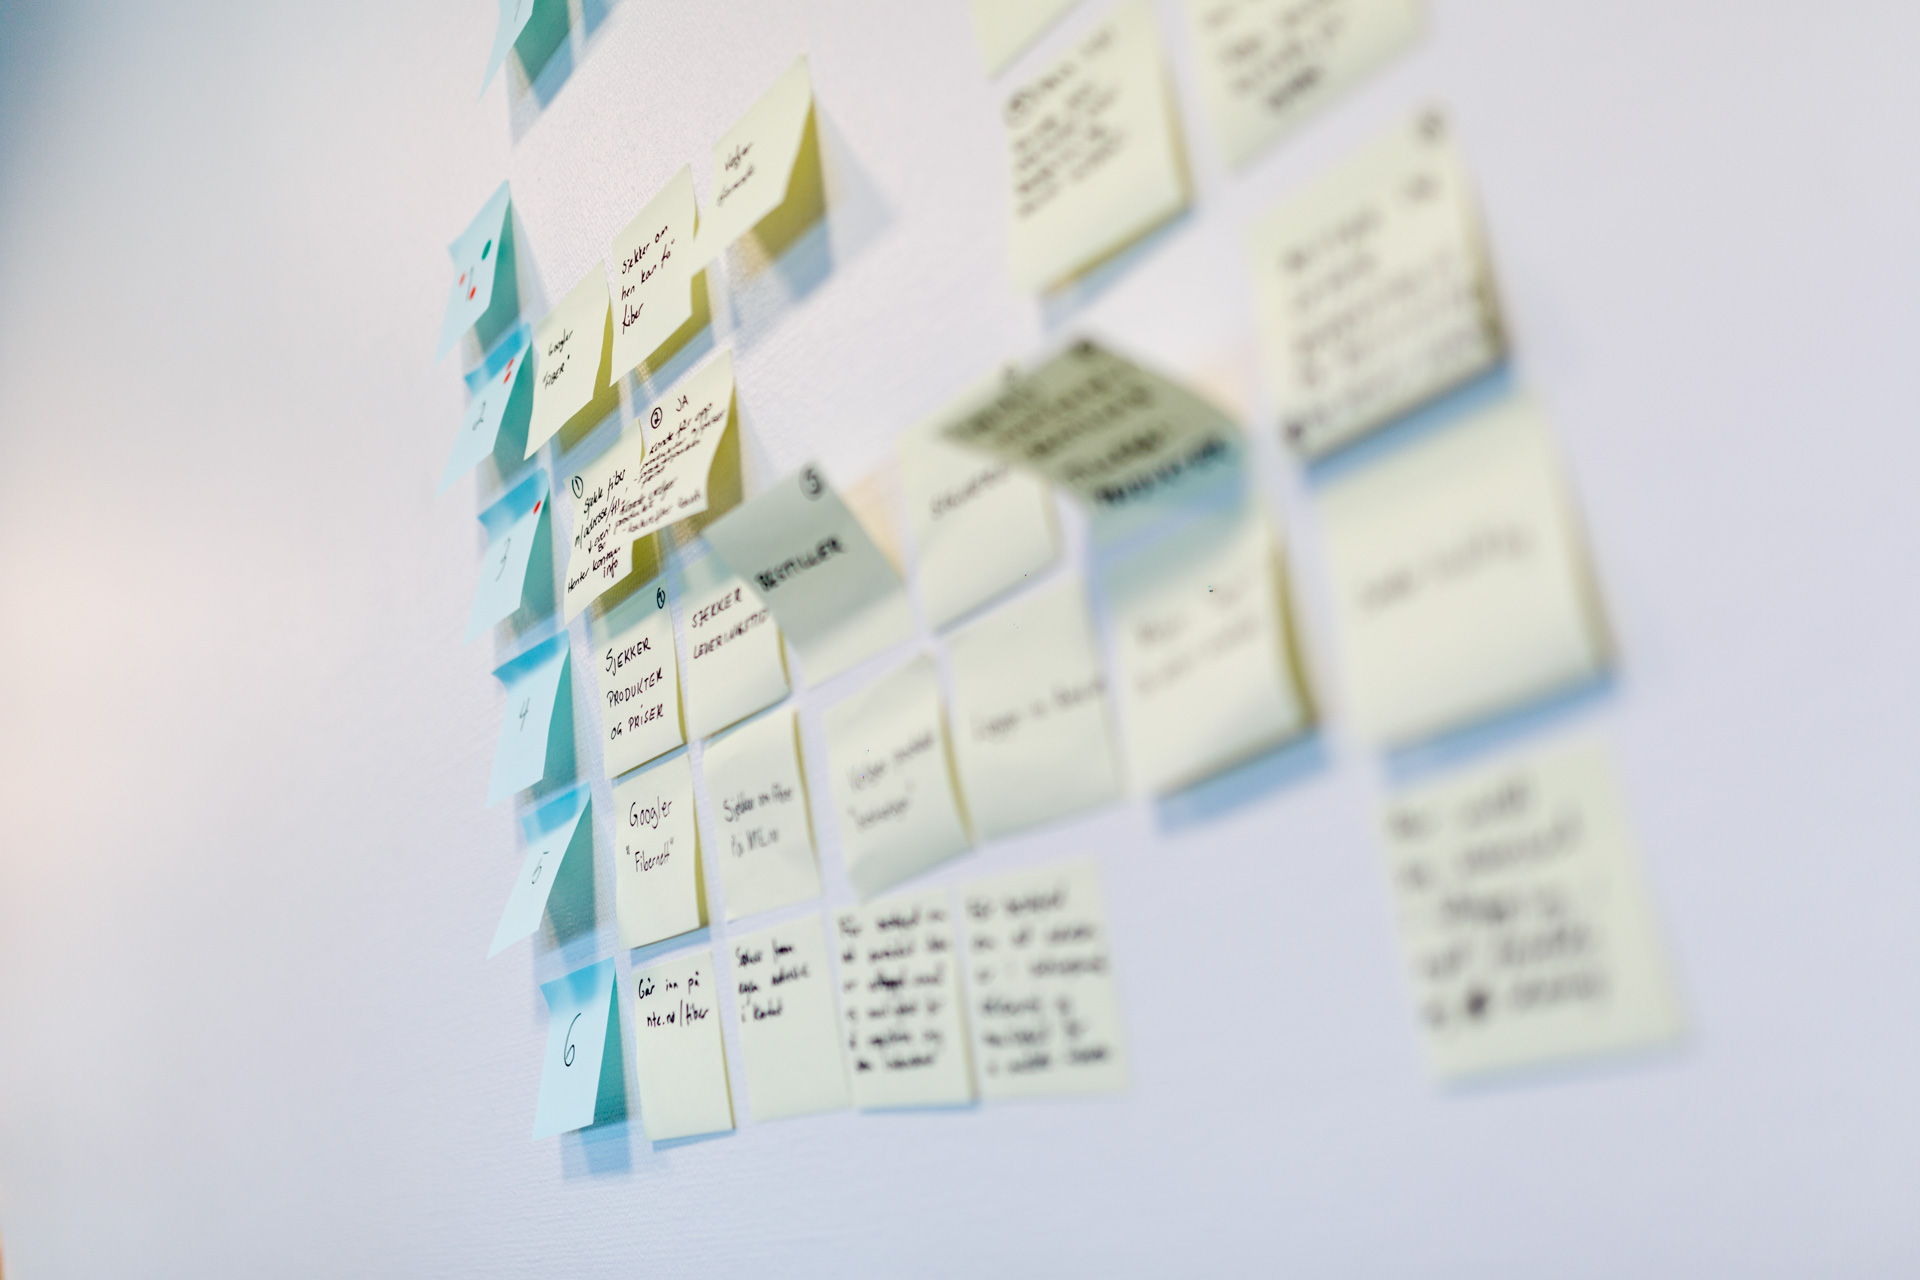
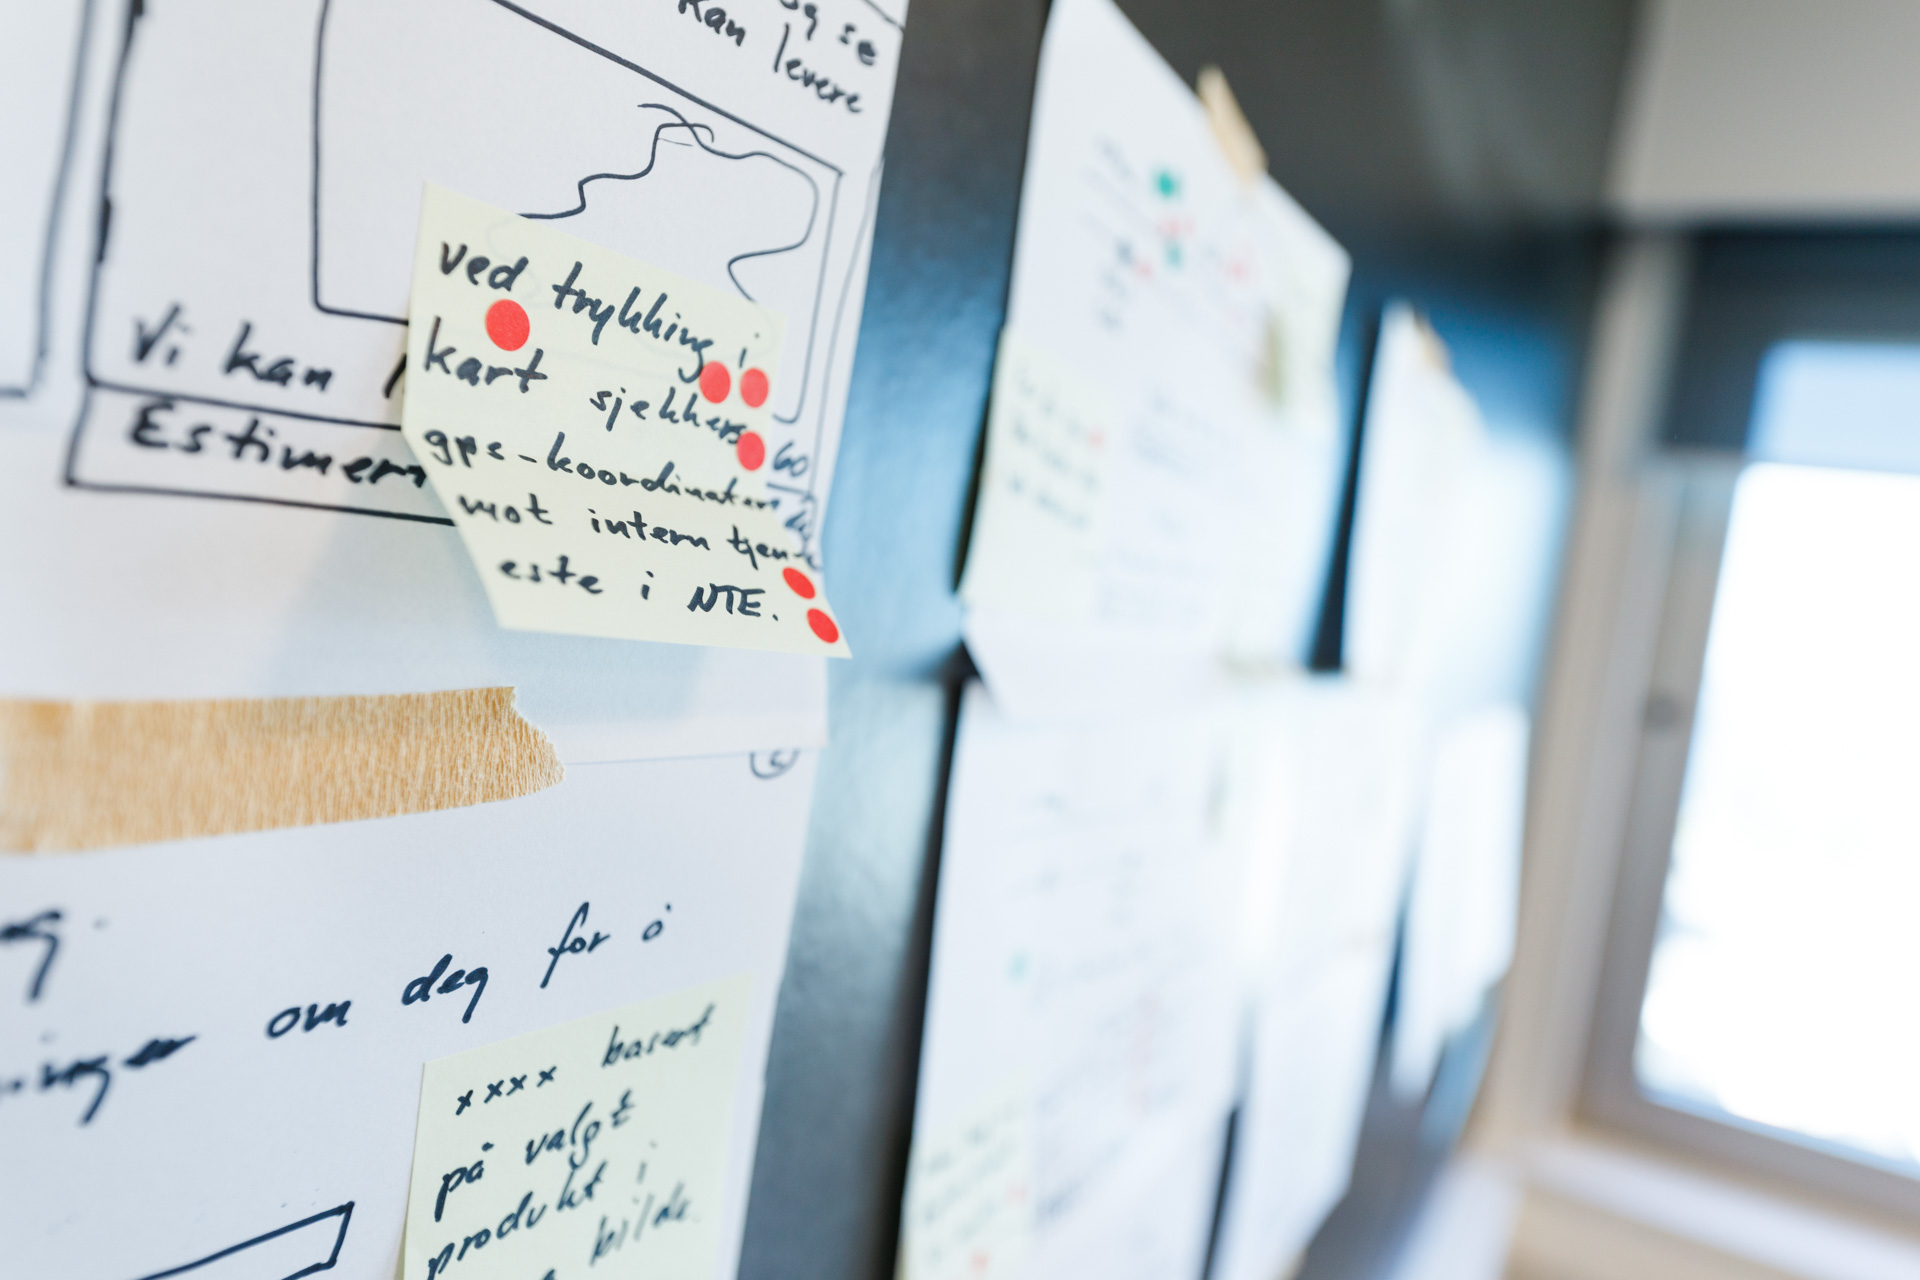
In Smart Media(as We) host a workshop with NTE candid discussions with all relevant stakeholders to understand their strategic goals, define their ideal state, and address their current pain points. Based on these inputs, NTE decided a customized power data user dashboard to deliver insights on vital aspects of the client’s power usage. Through conversations with top management and industry analysis.
Together in the workshop, we identified two main focus areas for improvement: Align the data and make it useable/accessible online, a customized platform for data visualization to increase user engagement.
We created a grid system for drop and drag function, also follow the NTE design profile to make consistency to decrease the difference from the landing site to the user portal. After few time elevations, we delivered a prototype for NTE’s customer to test out the functionalities, and slowly implement data visualizations.
The main focus on the design is clean, create the default data display to decrease complex data set-up, make data visualization follow design profile style.
On the back end, the workflow was streamlined through careful planning and process automation. The client’s data streams were seamlessly integrated into the cloud from multiple sources, including ERP systems, such as SAP, and other third-party vendors.

Object-Oriented UX (OOUX) for digital twins: insights to support scalable 3D view

Making 3D usable: OOUX finding from isolate & highlight features

Designing SaaS for digital twin: how discovery shaped the solution
(47) 41 33 16 51
Reach Me By Phone
Email Me
Rølivegen 367, Steinkjer, 7718, Trøndelag
📍 Based in Norway